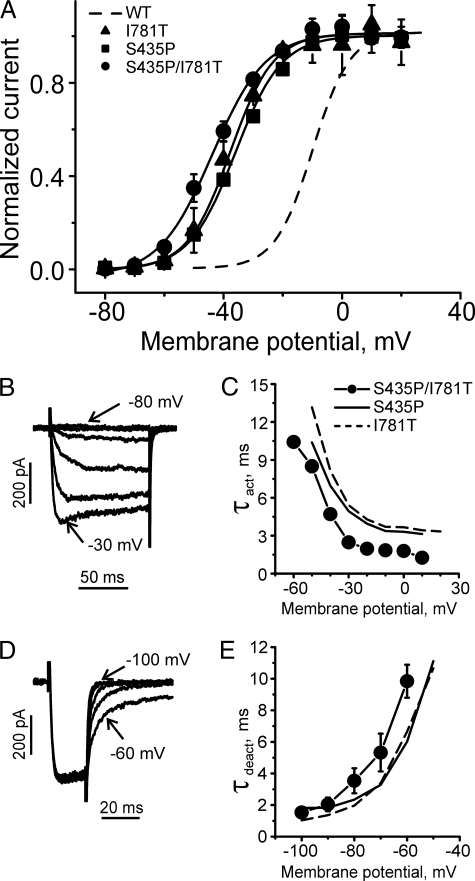
FIGURE 6.
Gating of double mutant S435P/I781T. A, averaged activation curves of mutants S435P/I781T (n = 5), S435P (n = 6), and I781T (n = 7). Wild type (WT) channel activation curve is shown by the dashed line. B, representative IBa through double mutant S435P/I781T during depolarizing pulses from a holding potential of -100 mV (10-mV increments). C, mean time constants of channel activation for S435P/I781T double mutant (n = 5) and S435P (n = 6) and I781T (n = 7) mutants are plotted versus test potential. D, representative tail currents through mutant S435P/I781T. Currents were activated during a 20-ms conditioning depolarization to -10 mV. Deactivation was recorded during subsequent hyperpolarization (10-mV increment) starting from -100 mV. E, mean time constants of channel deactivation for S435P/I781T double mutant (n = 5) and S435P (n = 6) and I781T (n = 7) mutants are plotted versus test potential. Time constants were estimated by fitting current activation and deactivation to a mono-exponential function (see “Experimental Procedures”).

