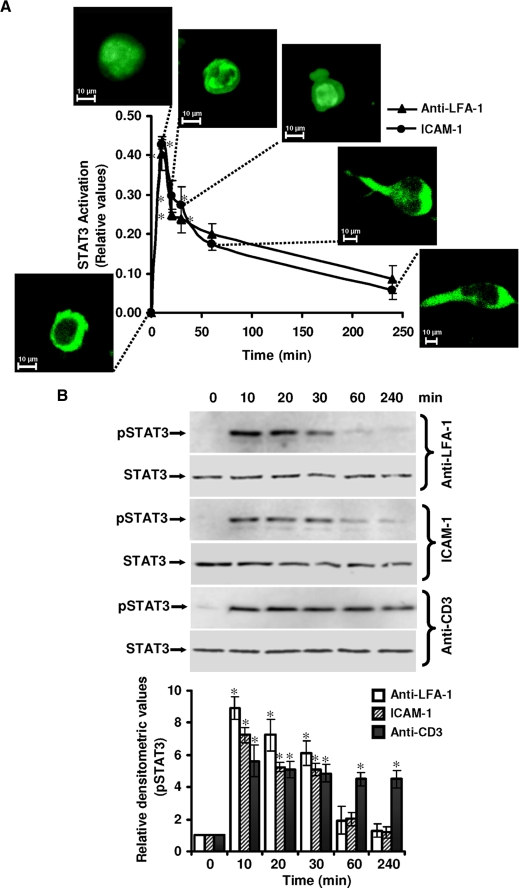
FIGURE 1.
STAT3 activation during LFA-1-induced T-cell migration. A, serum-starved Hut78 cells were incubated on a poly-l-lysine-coated (0 min) or anti-LFA-1- or ICAM-1-coated 96-well plate for 10, 20, 30, 60, or 240 min and fixed. Cells were labeled with the Cellomics® HCS reagent kit for STAT3 activation. Cellular images were acquired using an IN Cell Analyzer 1000 automated microscope and analyzed by Investigator image analysis software that quantifies nuclear to cytoplasmic fluorescence intensity. Data are normalized mean ± S.E. of three independent experiments in triplicate from three randomly selected fields per well containing at least 300 cells. The insets show representative cell images obtained at the indicated time points. B, serum-starved Hut78 cells were incubated on anti-LFA-1-, ICAM-1-, or anti-CD3-coated 6-well plates for the indicated times and lysed. Cell lysates (20 μg each) were resolved by SDS-PAGE and after Western blotting were probed with anti-phospho-STAT3 (Tyr705; pSTAT3) or anti-STAT3 (as a loading control) antibody. Relative densitometric analysis of the individual pSTAT3 band was performed and presented. Data are mean ± S.E. of three independent experiments. *, p < 0.05 with respect to corresponding control.

