FIGURE 4.
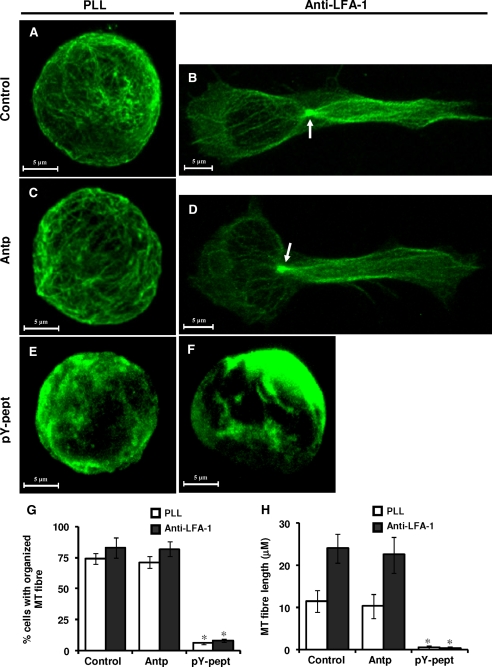
Effect of STAT3 inhibition on the organization of MT network in resting and LFA-1-stimulated T-cells. Hut78 cells untreated (Control; A and B) or pretreated with 25 μg/ml nonspecific peptide (Antp; C and D) or 25 μg/ml STAT3-inhibitory peptide (pY-pept; E and F) for 4 h were incubated on poly-l-lysine-coated (PLL; A, C, and E) or anti-LFA-1-coated (B, D, and F) Permanox® chamber slides for 4 h. After this time, the medium was carefully removed, and cells were fixed in 3% paraformaldehyde. Cells were immunostained for α-tubulin (green). The organization of the MT network was visualized by confocal microscopy using a ×63 oil immersion lens. The arrow indicates clearly distinguishable MTOC. G, organization of MT network in the population of cells. A minimum of 100 cells was scored by IN Cell Investigator HCA analysis software. H, semiautomated analysis of MT fiber length of 10 randomly selected cells was performed using the Zeiss LSM Image Examiner software. Results shown are representative of three independent experiments. *, p < 0.05 with respect to corresponding control.

