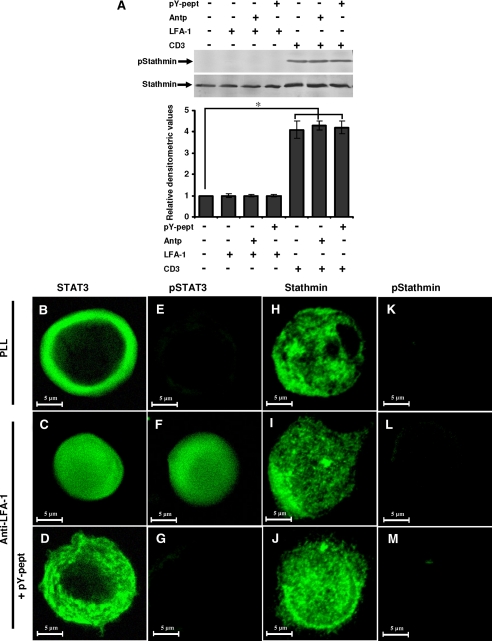
FIGURE 6.
Stathmin phosphorylation and localization during LFA-1-induced T-cell migration. A, serum-starved Hut78 cells were pretreated with 25 μg/ml nonspecific peptide Antp or 25 μg/ml STAT3-inhibitory peptide pY-pept for 4 h and incubated on anti-LFA-1- or anti-CD3-coated 6-well plates for 10 min and lysed. Cell lysates (20 μg each) were resolved by SDS-PAGE and after Western blotting were probed with anti-phosphostathmin (Ser16; pStathmin) or anti-stathmin antibody. Relative densitometric analysis of the individual pStathmin band was performed and presented. Data are the mean ± S.E. of three independent experiments. *, p < 0.05 with respect to control. B-M, Hut78 cells untreated or pretreated with 25 μg/ml STAT3-inhibitory peptide (pY-pept; D, G, J, and M) were incubated on poly-l-lysine (PLL) or anti-LFA-1-coated Permanox® chamber slides for 10 min. After this time, the medium was carefully removed, and cells were fixed in 3% paraformaldehyde. Cells were immunostained for STAT3, phospho-STAT3 (Tyr705; pSTAT3), stathmin, or phosphostathmin (Ser16; pStathmin) and visualized by confocal microscopy using a ×63 oil immersion lens.

