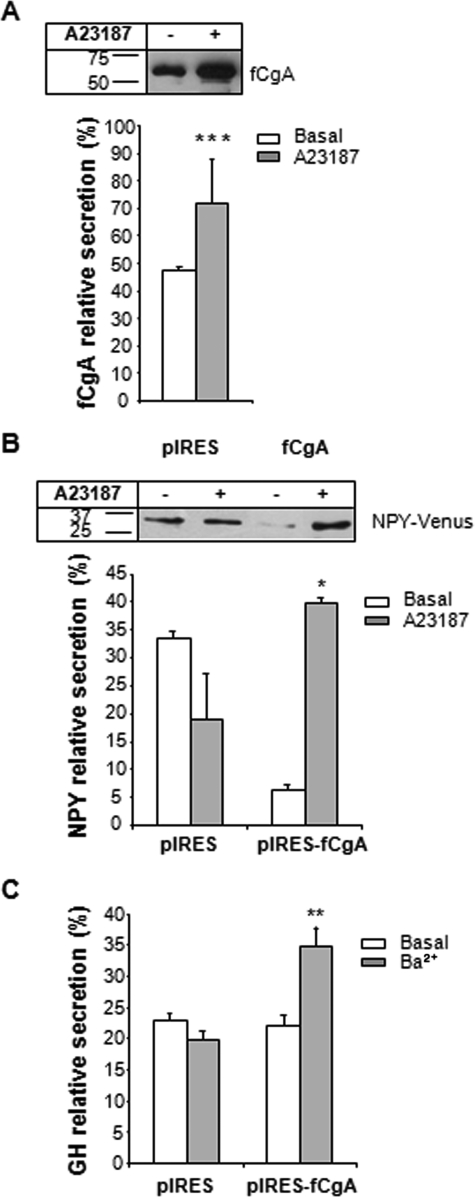
FIGURE 6.
Regulated secretion in CgA-expressing COS-7 cells. A, Western blot analysis of COS-7 cells expressing fCgA treated or not with 1 μm A23187 for 30 min. Approximately 50% of the release medium and 50% of the cell content were used for this analysis. The graph represents the mean values ± S.E. of normalized fCgA release in the medium relative to total CgA (medium plus cell content) (n = 3; ***, p < 0.001). B, Western blot analysis of COS-7 cells expressing NPY-Venus in the absence or presence of fCgA and treated or not with 1 μm A23187 during 30 min. The graph represents the mean values ± S.E. of normalized NPY-Venus release in the medium relative to total NPY-Venus (medium plus cell content) (n = 3; *, p < 0.05). Similar results were obtained after 15 min of stimulation with the Ca2+ ionophore. C, enzyme-linked immunosorbent assay analysis of COS-7 cells expressing GH in the absence or presence of fCgA, and treated or not with 2 mm BaCl2 during 15 min. The graph represents the mean values ± S.E. of normalized GH release in the medium relative to total GH (medium plus cell content) (n = 4; **, p < 0.01).

