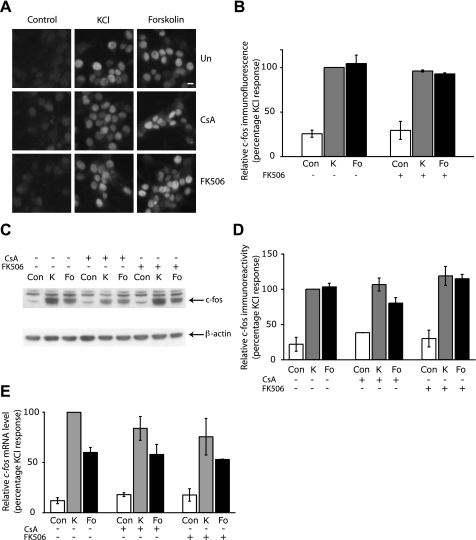
FIGURE 2.
Expression of c-fos is not affected by the suppression of calcineurin activity. A, representative example of hippocampal neurons showing nuclear c-Fos protein expression in cells pretreated with 1 μm CSA or 0.1 μm FK506 or left untreated (Un) for 15 min followed by stimulation with 50 mm KCl or 10 μm forskolin for 2 h. Scale bar, 10 μm. B, a graph showing the average level of c-Fos immunofluorescence in untreated cells (Con) or cells treated with 50 mm KCl (K) or 10 μm forskolin (Fo) for 2 h, with or without 0.1 μm FK506 pretreatment. Over 50 cells of each treatment from three independent experiments were analyzed. Values are shown as mean ± S.E. C, Western blot showing that the induction of c-Fos protein by 50 mm KCl (K) and 10 μm forskolin (Fo) is not changed by a 15-min pretreatment with either 1 μm CSA or 0.1 μm FK506. Neurons were stimulated for 2 h and processed for c-Fos immunoblotting (top). Immunoblots were stripped and probed with an antibody to β-actin (bottom). D, quantitative analyses of c-Fos protein levels from immunoblots is shown in the graph. The c-Fos and β-actin immunoreactivity was measured using Image J, and c-Fos levels were normalized to that of β-actin. Values are shown as mean ± S.E., and data are from three independent experiments. E, qPCR revealed that the induction of c-fos mRNA expression by 50 mm KCl (K) or 10 μm forskolin (Fo) in neurons stimulated for 50 min was unaffected by a 15-min pretreatment with either 1 μm CSA or 0.1 μm FK506. Values are represented as mean ± S.E., and data are from five independent experiments.

