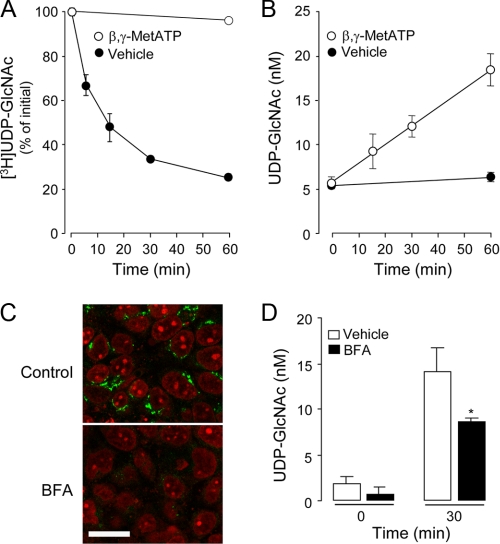
FIGURE 3.
Metabolism and cellular release of UDP-GlcNAc. A, UDP-[3H]GlcNAc (5 nm) was added for the indicated times to the mucosal compartment of polarized 16HBE14o- cells in the presence or absence of 300 μm β,γ-metATP. The resulting species were separated and quantified by HPLC, as indicated under “Experimental Procedures.” B, UDP-GlcNAc released to the extracellular medium was measured in the presence or absence of 300 μm β,γ-metATP. The data represent the mean value ± S.D. of two independent experiments performed in triplicate. C, cells were incubated for 1 h with vehicle or 3 μm BFA, and Golgi structures were revealed with monoclonal anti-Golgi p230 antibody, followed by FITC-labeled secondary antibody. Nuclei were stained with propidium iodide. Each panel is the overlay of the FITC (green) and nuclei (red) images acquired in face by confocal microscopy. Bar, 20 μm. D, UDP-GlcNAc measurements were performed in cells preincubated for 60 min in the presence of vehicle or 3 μm BFA. At the end of this period, 300 μm βγ-metATP was added to cells for an additional 30 min. The data represent the mean ± S.D. from at least two experiments performed in quadruplicates.

