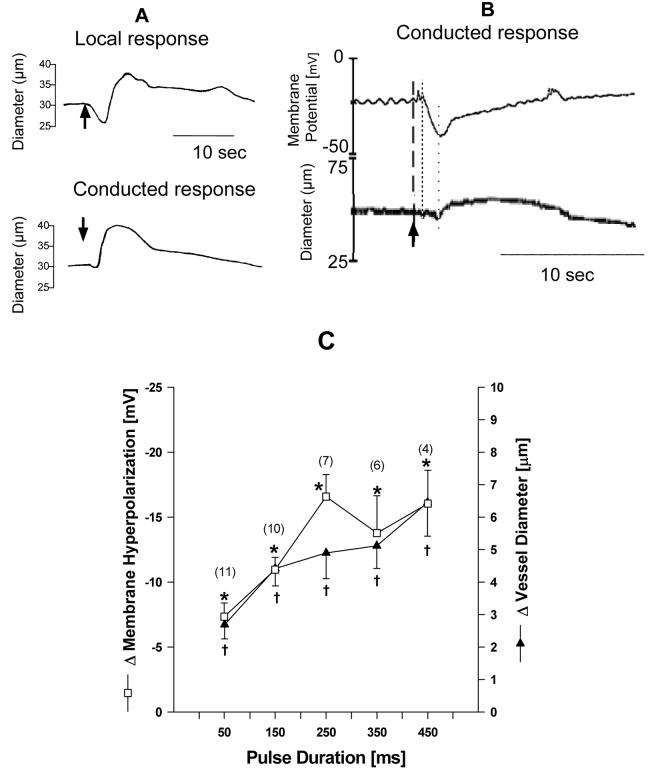
Figure 1.
Panel A shows diameter traces of the local and conducted vasomotor response to micro-applied ATP (arrow) with a transient local constriction (downstroke) followed by a dilation with only a small conducted initial constriction but a strong conducted dilation (upstroke). Panel B shows the simultaneous measurement of conducted vasomotor responses and membrane potential to micro-applied ATP (arrow) with the hyperpolarization (fine dotted line) preceding the dilation (coarse dotted line). Panel C shows that stimulus-dependent increase between conducted dilation and membrane hyperpolarization to increased ATP pulses. * and †denote p < 0.05 from pre-stimulation control (ANOVA).

