
Fig. 1.
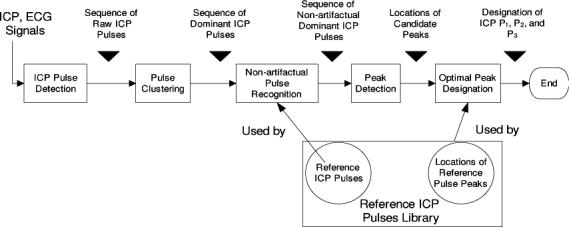
Flow chart of the proposed morphological clustering and analysis of the intracranial pressure. There are five blocks in the flow chart representing the five major processing blocks. In addition, a reference library of non-artifactual ICP pulses and their component peaks is used by the pulse recognition and optimal peak designation blocks of the algorithm.