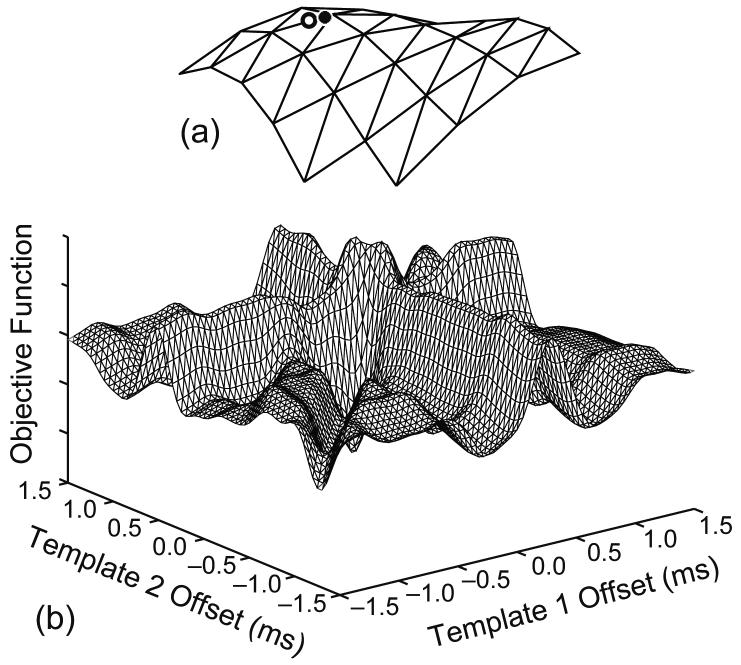
Fig. 2.
Objective function for the superposition in Fig. 1. For clarity, it is plotted upside down, so that the peaks correspond to good alignments. (a) The central peak. The known-constituent PSO algorithm successfully located the global minimum (circle), which was very close to the true alignment (star). (b) A wider region. In both plots the grid interval is 0.1 ms.

