
Figure 1.
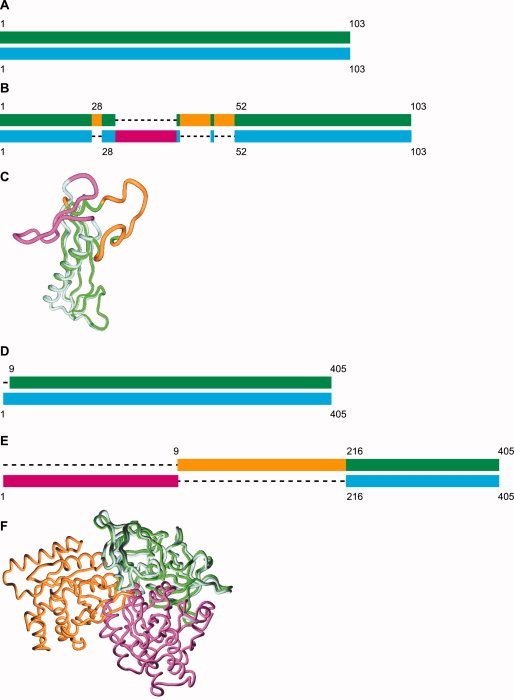
Two examples of how structure alignment can underestimate structural dissimilarity. (A, B) Schematic representation of the sequence alignment (A) versus structural alignment (B) of chain A versus chain D from PDB ID 1vr4. The two chains are 100% identical in sequence. The aligned parts are colored green (chain A) and cyan (chain D), while the unaligned parts are colored orange and magenta, respectively. The RMSD of all sequence-aligned residues is 7.1 Å, while that of the structurally-aligned residues is 1.4 Å. (C) Structural-alignment based superposition of chains A and D of 1vr4 (colored as in panel B). (D, E) Schematic representation of the sequence alignment (D) versus structural alignment (E) of two structures of the elongation factor Ef-Tu from Thermus aquaticus—PDB ID 1tui chain A (GDP bound) and 1eft (GTP bound). Inter-domain changes (hinge motion) cause structure alignment programs to align only one domain and ignore the rest of the protein. The aligned parts are colored green (1tui) and cyan (1eft), while the unaligned parts are colored orange and magenta, respectively. The RMSD of all sequence-aligned residues is 10.3 Å, while that of the structurally-aligned residues is 1.3 Å. Note that 1tuiA is not in our dataset because this structure was solved at a resolution of 2.7 Å. Homologs of 1tuiA from E.coli, with ∼70% sequence identity to 1tuiA and to 1eft are in our dataset. These orthologs (e.g. 1dg1G, 1d8tA) are similar in structure to 1tuiA and dissimilar to 1eft, with RMSDs > 10 Å to the latter structure. (F) Structural-alignment based superposition of 1tui chain A and 1eft (colored as in panel E).