
Figure 4.
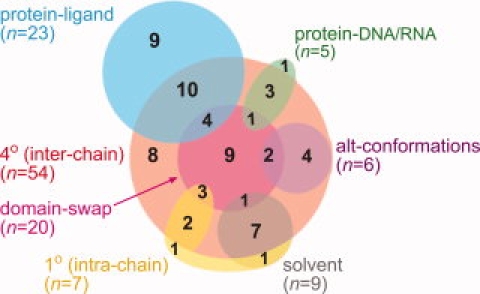
Causes for the marked structural dissimilarity between protein pairs with ≥99% sequence identity and RMSD ≥ 6 Å. The Venn diagram shows the distribution of causes for the structural dissimilarity within pairs. A detailed explanation of each category is given in the text. n refers to the number of occurrences of each cause, out of the 66 separate clusters examined.