
Figure 5.
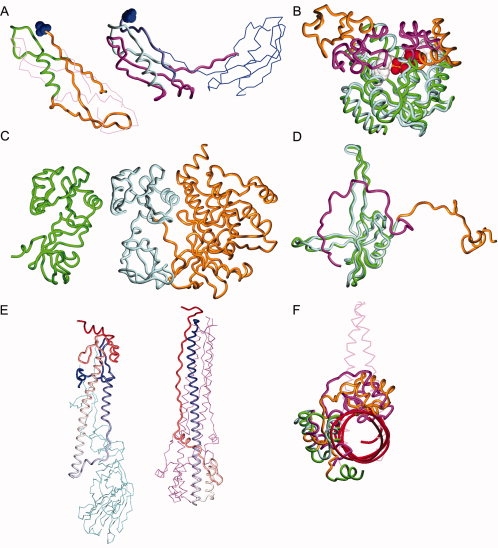
Examples of pairs with highly-similar sequences and structure dissimilarity that is related to biological function. (A) The bacterial protein TonB (1ihrB–1u07A, Inter-chain; Domain-swap; Intra-chain, RMSD of 20.4 Å, 100%): both compared structures are homodimers with a different domain-swapped interface, shown side by side for clarity. The structurally dissimilar regions are colored magenta (1u07A) and orange (1ihrB). 1u07 contains a 14 residue N-terminal stretch, depicted as a purple worm, which is absent in 1ihrB. The N-terminal residue of both compared chains is depicted in CPK model and the second monomer in each structure is depicted in Cα wire representation. (B) Adenylate kinase (1akeA–4akeA, Protein-ligand, RMSD of 7.1 Å, 100%): the ligand-bound form is superimposed on the apo form. The so called “lid” and “NMP” domains, which change conformation significantly upon ligand binding, are colored orange (1akeA, the apo form) and magenta (4akeA, the ligand-bound form). The ligand is depicted in CPK model. (C) The SH2-SH3 domains of cABL (2abl–1opkA, Intra-chain, RMSD of 9.5 Å, 95%): 1opk contains the cABL kinase domain (orange worm), which is absent in 2abl. This results in different SH2-SH3 domain-domain interaction (“inter-domain” differences). The two structures are displayed side-by-side for clarity. (D) The apo structure of the E.coli single-strand DNA-binding (SSB) protein (1qvcA–1qvcB, Inter-chain; Alt-conformations, RMSD of 20.7 Å, 100%): the two compared chains (out of four dissimilar chains in the homo-tetramer) are superimposed, and the variable C-terminus is colored orange (chain A) and magenta (chain B). (E) Influenza haemagglutinin (2viuB–1qu1F, Inter-chain; Solvent, RMSD of 39.8 Å, 94%): The two structures are displayed side-by-side for clarity and the two compared chains are colored in a gradient from blue (N-terminal) through white to red (C-terminal). The additional interacting chains are depicted in Cα wire representation. (F) The c-Myb transcription factor (1gv2A–1h89C, Inter-chain; Protein-DNA, RMSD of 7.1 Å, 100%): the apo form is superimposed on the DNA bound form, which also includes two chains of the C/EBPβ enhancer protein, depicted in Cα wire representation. The DNA backbone is depicted in red worm and the structurally variable regions are colored magenta (1gv2A) and orange (1h89C). In parenthesis for each example are the two protein chains, designated by their PDB id and chain ID, the causes for the structural differences between the two chains, the sequence-based superpositioning RMSD and the coverage (percentage of the alignment length from the length of the shorter chain). The compared chains are depicted as backbone worms. Unless stated otherwise, the first chain in each pair is colored green and the second chain cyan.