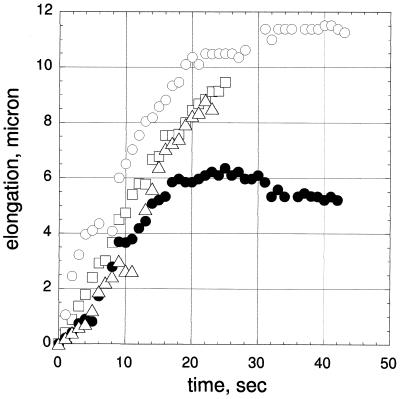
Figure 4.
Time course of the protrusion elongation. The data were obtained from the measurement made for the liposomes shown in Fig. 2 b–d. Symbols ▵ and □ represent the protrusions in b and c; ○ and ●, the left and right protrusions in d. Zero corresponds to the time when protrusion became recognizable by eye.

