
Table 3.
Matrix of IDI values for the cWW family
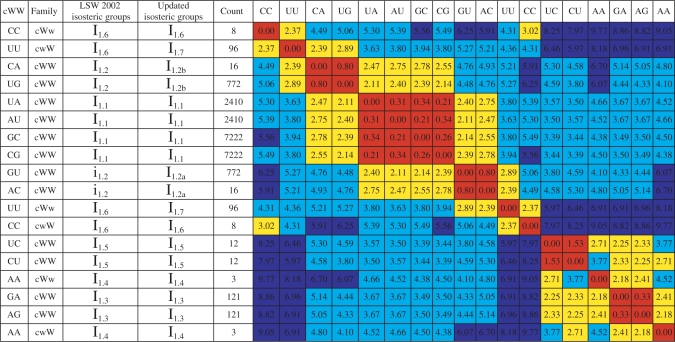 |
The IDI was calculated for each pair of cWW base pair exemplars, as indicated by the column and row labels. Cells in this and other tables are color-coded to reflect the IDI thresholds: (1) red: isosteric base pairs (IDI ≤ 2.0); (2) yellow: near isosteric base pairs (2.0 < IDI ≤ 3.3); (3) cyan: non-isosteric base pairs (moderate IDI: 3.3 < IDI ≤ 5.0); (4) blue: very different base pairs (large IDI: 5.0 < IDI). Base pairs are grouped to form isosteric and near isosteric blocks. The column labeled ‘LSW’ indicates the isosteric subgroups reported in (1). The column labeled ‘Count’ indicates the number of instances of the base pair observed in the reduced-redundancy set of structures.