
Table 4.
Average IDIs within and between geometric families
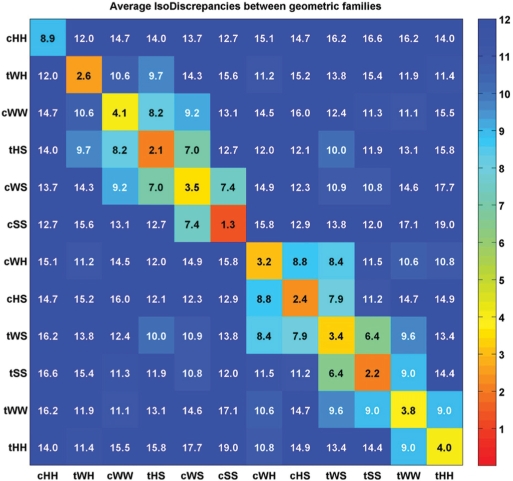 |
The values shown in cells along the diagonal are the average IDIs within geometric base pairing families, while the values shown in off-diagonal cells are the average IDIs between base pairing families. For each pair of families, the minimum IDI was computed between each pair of exemplars, and averaged over all pairs. The families are arranged in the matrix to group similar families near one another, forming two main groups. Each cell is colored according to the scale on the right. All cells with IDIs above 12 are colored dark blue.