
Table 7.
Counts and frequencies of base pairs found in RNA 3D structures, by geometric base pair family
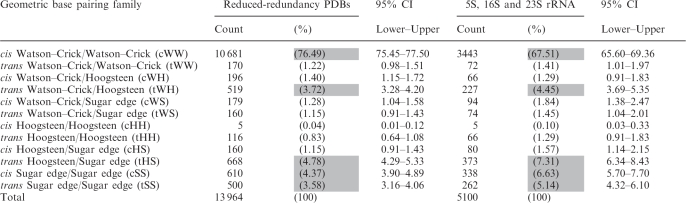 |
For each base combination we report eight numbers; the first is the base pair count from the reduced-redundancy set of 3D structures, the second is the percentage this represents of the total and the third and fourth are simultaneous 95% CI for the frequencies reported as percentages. The second set of four numbers in each row reports the results obtained only using base pairs drawn from five representative rRNA structures [50S H. marismortui (PDB: 1s72), E. coli (PDB: 2aw4) and T. thermophilus (PDB: 2j01) and 30S E. coli (PDB: 2avy) and T. thermophilus (PDB: 1j5e)].