
Table 8.
Base pair counts and percent frequencies for the tWH base pair family, with simultaneous 95% CIs
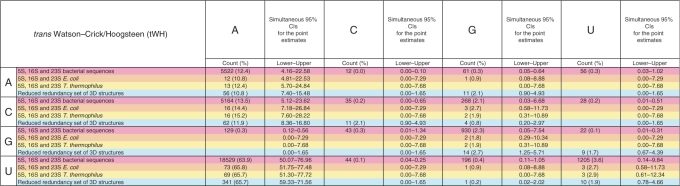 |
Each cell contains data from four sources: (1) pink: 5S, 16S and 23S bacterial sequence alignments; (2) orange: 5S, 16S and 23S E. coli ribosome 3D structure (2avy and 2aw4); (3) yellow: 5S, 16S and 23S T. thermophilus ribosome structure [1j5e and 2j01(11,12)]; and (4) cyan: reduced-redundancy dataset of PDB files. For sequence alignments, the counts represent the number of instances of the respective base combination that occur in columns of the 5S, 16S and 23S rRNA sequence alignments (3,4) that correspond to tWH pairs in the conserved core of the 3D structural alignments. Corresponding tables for all 12 families appear in Supplementary Table S8.