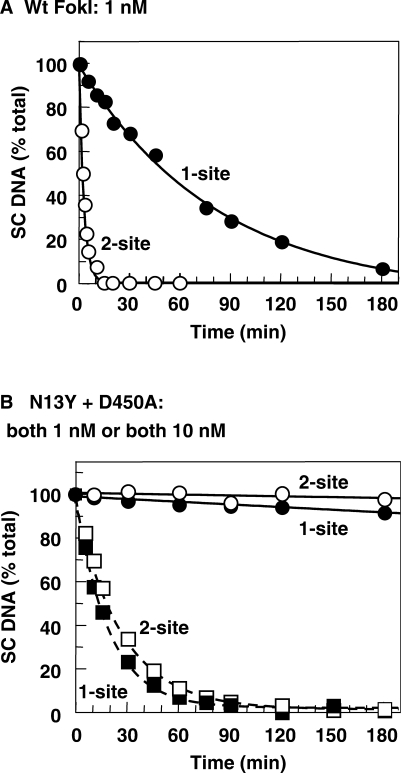
Figure 5.
Reaction rates. The reactions, in Buffer 4 at 37°C, contained 5 nM 3H-labelled DNA and FokI protein at either 1 nM or 10 nM, as indicated below. At timed intervals after adding the protein(s) to the DNA, samples were removed, quenched and analysed as described in Materials and methods section to obtain the concentrations of the SC, OC and LIN DNA. The residual concentration of SC DNA at each time point is given as a percentage of the total DNA in that sample. (A) Reactions of 1 nM wt FokI on: pSKFokI (one recognition site), black circles; pIF190 (two FokI sites), white circles. (B) Reactions with a mixture of N13Y and D450A, both at 1 nM, on pSKFokI (black circles) and on pIF190 (white circles). Also shown in (B) are the reactions with the mix of N13Y and D450A, both at 10 nM, on pSKFokI (black squares) and on pIF190 (white squares), both with dashed lines.

