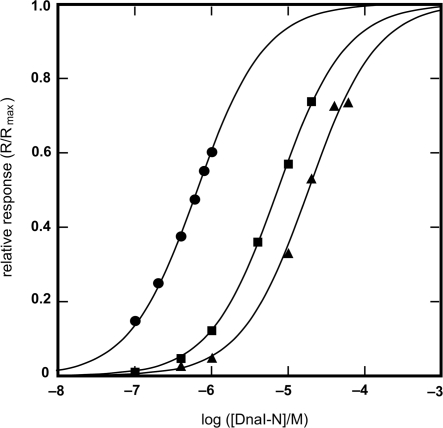
Figure 5.
Binding isotherms for the interaction of Bst DnaB with DnaI-N domain constructs, as measured by SPR. Experimental points obtained with: DnaI-N132 (filled circle), DnaI-N123 (filled square) and DnaI-N106 (filled triangle). The KD values for these interactions, determined by the least squares fit to a 1:1 binding model (solid lines) are: DnaI-N132, 0.65 μM; DnaI-N123, 7.3 μM; DnaI-N106, 18.5 μM. Given the difference in the KD values, different ranges of protein concentrations were used: DnaI-N132, 0.1–1 μM; DnaI-N123, 0.1–20 μM; DnaI-N106, 0.1–60 mM. The responses (R, in RU) were normalized using the computed value of the maximum response at equilibrium (Rmax), which corresponded to 0.8, 1.7 and 1.8 molecules of DnaI-N132, DnaI-N123 and DnaI-N106, respectively, bound per Bst DnaB subunit.

