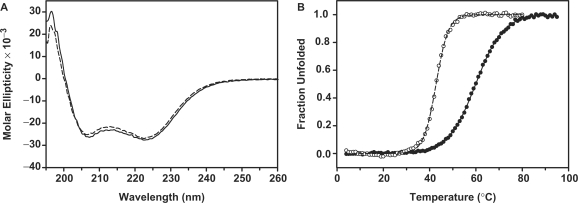
Figure 2.
Comparison of CD data between tvMyb135–131 (dashed line) and tvMyb135–141 (solid line). (A) CD spectra of tvMyb135–141 and tvMyb135–131 at 25°C, indicating that two proteins exhibit similar secondary structures. (B) The equilibrium thermal unfolding experiments followed at 222 nm. The Tm value of tvMyb135–141 is 59.9°C, around 17°C higher than that of tvMyb135–131.

