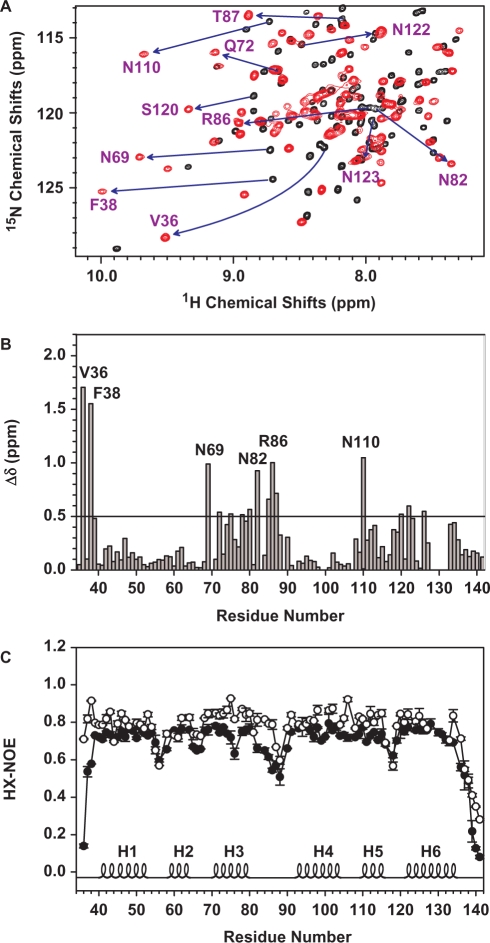
Figure 4.
Interaction between tvMyb135–141 and 16-bp MRE-1/MRE-2r DNA duplex analyzed by NMR. (A) Overlay of portion of the 2D 1H-15N HSQC spectra of free tvMyb135–141 (black) and tvMyb135–141 in complex with DNA (red). The residues that exhibit significant chemical shift perturbations are indicated. (B) Weighted chemical shift perturbations for backbone 15N and 1HN resonances as calculated by the equation: Δδ = [(ΔδHN)2 + (ΔδN/5)2]0.5. The solid line indicates 0.5 ppm (equal to Δδaverage + SD). (C) 1H-15N hetero-nuclear NOE of tvMyb135–141 in free form (filled circles) or in complexed with DNA (open circles). The secondary structures are annotated in the bottom.

