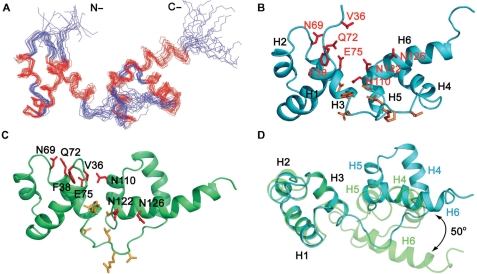
Figure 5.
The tvMyb135–141 solution structure in free form and in DNA-bound conformation. (A) The ensemble of 20 final structures of tvMyb135–141 in DNA-bound conformation. The structures were derived from refining the free structure with 1DNH RDC constraints obtained from the tvMyb135–141/DNA complex sample. The structures with lowest RDC energies were selected. (B) Cartoon representation of tvMyb135–141 in DNA-bound conformation. The residues that exhibit significant chemical shift changes upon DNA binding are shown in stick and are colored in red for those selected as active residues in HADDOCK docking. (C) Cartoon representation of tvMyb135–141 in free form. The residues that exhibit significant chemical shift changes are also shown. (D) Structural superimposition of tvMyb135–141 R2 motifs in free form (light green) and DNA-bound form (light blue) revealed that the orientation of R3 motif in DNA-bound conformation rotated 50° relative to that in free form.

