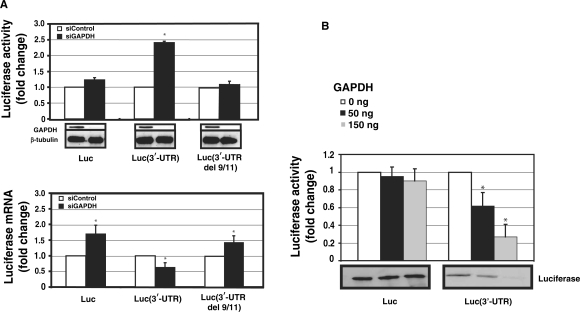
Figure 4.
The effect of RNAi-mediated GAPDH knockdown on the expression of AT1R. HEK293 cells were cotransfected with luciferase vector and with 30 nM gene-specific GAPDH siRNA (black bars) or equal amount of control siRNA (white bars). (A) Upper panel: Luciferase activities of luciferase coding region only or fused with full length AT1R 3′-UTR or mutated full-length 3′-UTR del 9/11. Luminometer measurements for this and subsequent experiments are expressed as fold of promoter control without 3′-UTR in relative light units of firefly luciferase. Results represent the means ± SD of an average of three independent experiments performed as a triplicate for each construct. β-Tubulin was measured to control for protein loading. *P < 0.05 versus siControl-treated cells. Lower panel: Luciferase mRNA was quantified by quantitative PCR. All the results were normalized to β-actin expression. *P < 0.05 versus siControl transfected cells. (B) GAPDH suppresses AT1R 3′-UTR translation. The same transcripts as in Figure 1 were used. Increasing amounts of GAPDH was added to the reaction mixture (white bars 0 ng, black bars 50 ng and gray bars 150 ng). The translated product was evaluated by two methods. First, luciferase activity of the translation mixture was measured (upper panel). Second, lysate was separated on SDS–PAGE gel, blotted and detected on a membrane by streptavidin-HRP (lower panel). Experiment with and without AT1R 3′-UTR represent different exposures and therefore baseline difference between these two constructs cannot be compared. The results represent the means ± SD of an average of three independent experiments. *P < 0.05 versus control reaction with no GAPDH.

