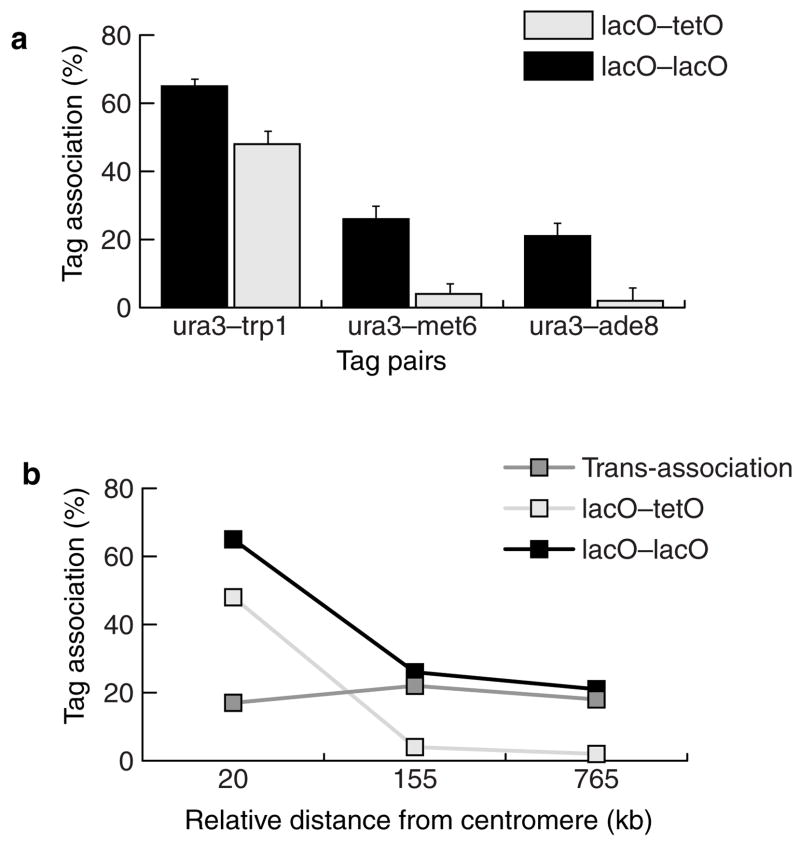
Figure 5. Trans-association of chromosomal tags.
a, Trans-association between lacO–lacO (black bars) and lacO–tetO (open bars) tags located at different centromere-to-locus distances. The tagged loci are ura3 (35 kb from CEN), trp1 (15 kb), met6 (190 kb) and ade8 (800 kb). lacO–tetO associations were used as a control to identify the subset of lacO–lacO associations that is due to sequence identity. b, Association between lacO–lacO (black points) repeats, lacO–tetO (open points) and trans-association (grey points), plotted as a function of relative centromere distance (subtraction of centromeric distances of two loci in each pair). Trans-association values were obtained by subtracting lacO–tetO associations from lacO–lacO.

