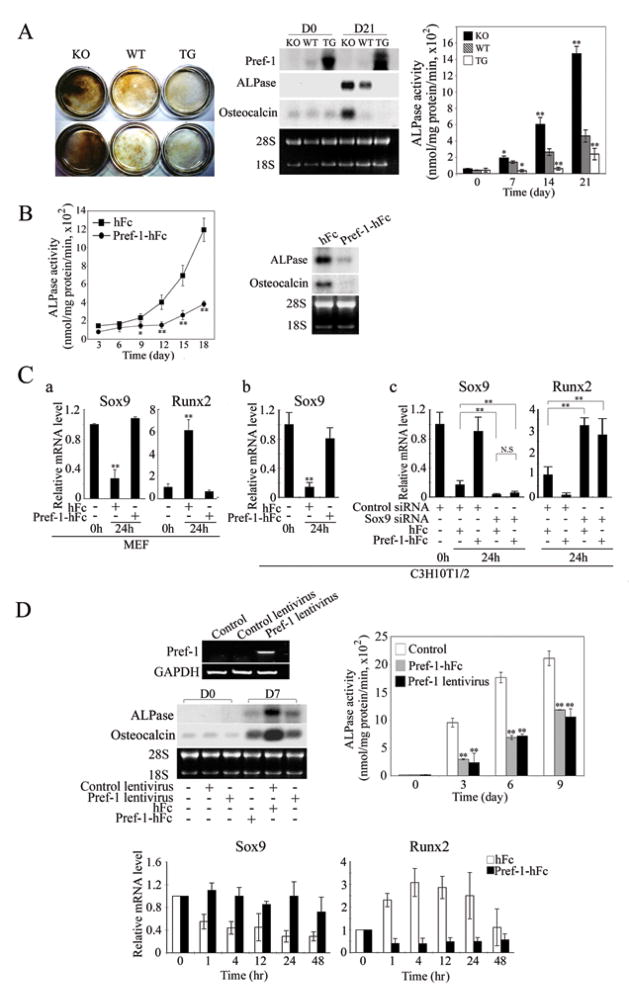
Figure 5.
Pref-1 inhibits osteoblast differentiation by preventing the decrease in Sox9 expression. (A) Von Kossa staining of MEFs after 21-days of osteoblast differentiation (left panel). Northern blot analysis (middle panel) and ALPase activity (right panel). Results are means ± SEM; *, P<0.05 and **, P<0.01 compared to wild-type cells at indicated time points. (B) ALPase activities (left panel) and Northern blotting after 18-days of osteoblast differentiation (right panel). (C) RT-qPCR for Pref-1 null MEFs and C3H10T1/2 cells cultured for in osteogenic media (a and b). siRNA transfected C3H10T1/2 cells cultured in osteogenic media (c). For Sox9 expression, the value of untreated cells was defined as 1. For Runx2, due to its undetectable level in untreated cells, the value of control siRNA transfected cells after 24 hr treatment was defined as 1. (D) RT-PCR after 48 h lentivirus infection in MC3T3 cells. Northern blot analysis from confluent MC3T3 cells (D0) and 7-days osteogenic treatment (D7), and ALPase activity, **, P<0.01 compared to cells infected with control lentivirus and cultured with hFc at indicated time points. RT-qPCR during osteogenic differentiation (bottom panel).

