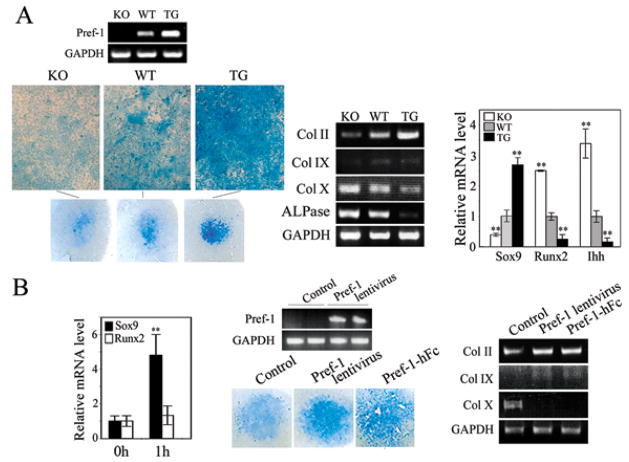
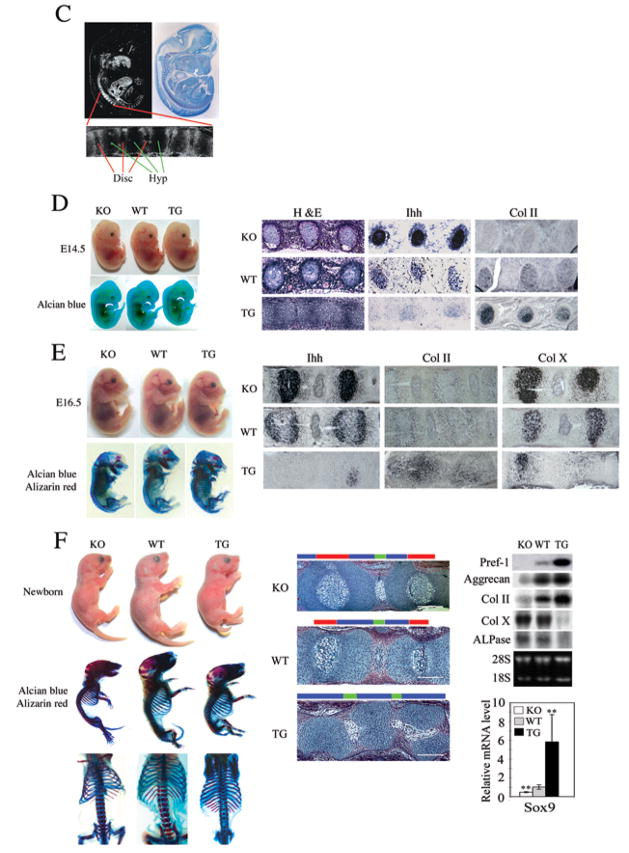
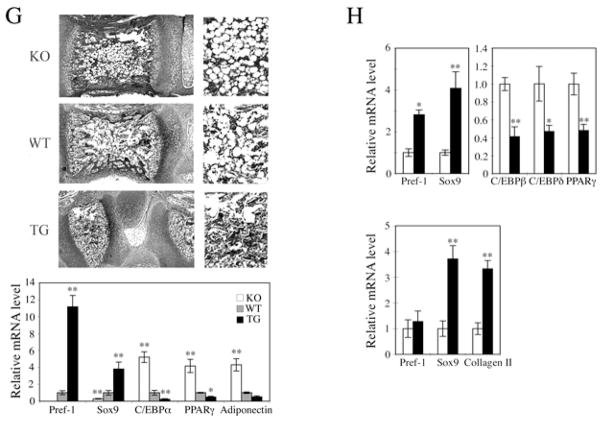
Figure 7.
Pref-1 promotes chondrogenic induction but inhibits chondrocyte maturation through upregulation of Sox9. (A) Micromass culture of cells from newborn tails. Alcian blue staining and RT-PCR and RT-qPCR for chondrogenic markers. **, P<0.01 compared to wild-type. (B) RT-qPCR after 1 hr treatment with 50 nM Pref-1-hFc (left panel), **, P<0.01 compared to untreated cells. RT-PCR in cells 48 hrs after infection. (C) In situ hybridization of E13.5 embryos with 33P labeled Pref-1 anti-sense probe (left panel) and bright field view with hematoxylin staining (left panel). Thoracic-abdominal vertebra region is enlarged (bottom). Disc, spinal disc; Hyp, hypertrophic zone. Embryos and mice, and their skeleton staining (alcian blue for cartilage and alizarin red for bone) in various developmental stages (D–F). Thoracic-abdominal vertebra was used for in situ hybridization with digoxigenin labeled anti-sense probe. H&E staining of 4–5th coccyges from newborn mice (F, middle panel). Color bars represent the length of different histological area. Red bar, zones of hypertrophic chondrocytes; blue bar, the area of resting and proliferating chondrocytes and prehypertrophic chondrocytes; green bar, spinal disc. White bar = 200 μm. Northern blotting and RT-qRCR for skinned tails of newborn mice. **, P<0.01 compare to wild-type. (G and H) Role of Pref-1 in MSC commitment and differentiation. (G) H&E staining (upper panel) of 5th coccyges of 1 wk-old mice and higher magnitude of bone marrow region (right). RT-qPCR for femur bone marrow from 12 week-old mice (n = 5) (lower panel). Results are mean ± SEM; **, P<0.01 compare to wild-type. (H) RT-qPCR of human primary MSC after 2 days adipogenic (upper panel) or chondrogenic treatment (lower panel). *, P<0.05 and **, P<0.01.


