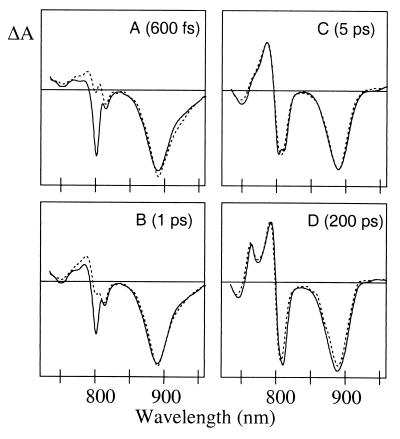
Figure 2.
Transient absorbance difference spectra obtained at 600 fs (A), 1 ps (B), 5 ps (C), and 200 ps (D) after a ∼200-fs excitation pulse centered at 796 nm (solid lines) and 880 nm (dotted lines). The spectra are reconstructed from the global analysis and are corrected for group velocity dispersion and IRF. The spectra were normalized to the maximum amplitude of the bleach of the P absorbance band at 5 ps (C).

