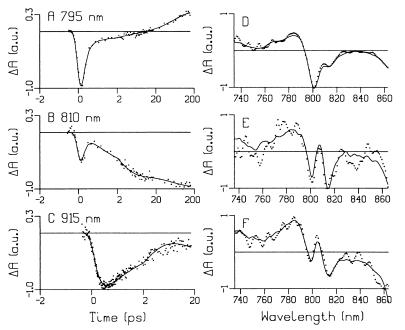
Figure 4.
(A–C) Kinetic absorbance difference traces at 795, 810, and 915 nm obtained after a ∼200-fs excitation pulse at 796 nm. The time axes are linear between −2 and 2 ps and logarithmic between 2 and 200 ps. The global analysis fit is depicted with the solid line. (D–F) Typical uncorrected transient absorbance difference spectra (points) recorded at 950, 750, and 700 fs after 796-, 818-, and 880-nm excitation, respectively, together with the result of the global analysis fit (solid line). The maximal ΔOD is 0.04, 0.012, and 0.02 OD for spectrum D–F, respectively.

