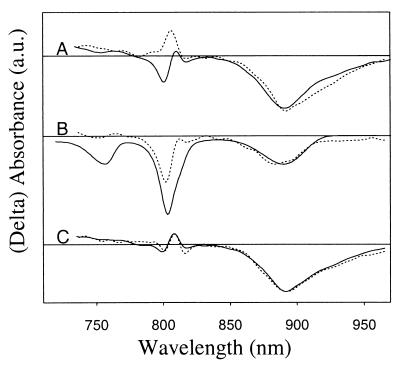
Figure 5.
(A) Overlay of the SADS from Fig. 3A (dotted line) and 3E (solid line). The spectra were normalized on the P bleaching in the relevant P+HA− SADS (Fig. 3 B and F, respectively). (B) Comparison of the difference between the 796-nm excitation SADS of A and 60% of the 880-nm excitation SADS of A (dotted line) with the minus ground state absorbance spectrum (solid line). (C) Comparison of the sum (equal contributions) of the 880- and 796-nm excitation SADS from A (solid line) with the 818-nm excitation SADS from Fig. 3I (dotted line).

