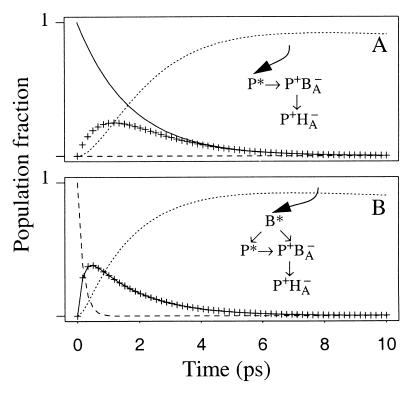
Figure 6.
Kinetic scheme to describe the experiments in which P (880 nm) and B (796 nm) are excited. The concentration profiles of B* (dashed line), P* (solid line), P+BA− (crosses), and P+HA− (dotted line) were calculated according to the depicted kinetic scheme for P (A) and B (B) excitation by using lifetimes of 360 fs for B* → P+BA−, 360 fs for B* → P*, 1.7 ps for P* → P+BA−, 0.85 ps for P+BA− → P+HA−, and 80 ps for the state P+HA−. At time zero the population was considered to be 100% B* and 100% P* for B and P excitation, respectively.

