Table 5.
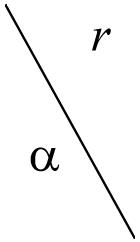
Validity of clusters depending on different degrees of α for dataset B. Two measures were used: compactness and separation [31] and z-scores [33], shown in parentheses. The z-scores are computed as an average of 10 repetitions for each pair of α and r.
 |
0.1 | 0.2 | 0.3 | 0.4 | 0.5 |
|---|---|---|---|---|---|
| 0.00 | 58.8 (317.9) | 58.8 (317.9) | 58.8 (317.9) | 58.8 (317.9) | 58.8 (317.9) |
| 0.10 | 35.9 (316.6) | 26.6 (319.6) | 23.6 (330.4) | 27.4 (336.9) | 30.6 (326.4) |
| 0.20 | 24.8 (322.9) | 29.1 (327.2) | 31.5 (333.7) | 29.6 (332.4) | 29.5 (318.7) |
| 0.30 | 26.9 (329.2) | 30.5 (332.5) | 30.5 (322.1) | 45.4 (338) | 60.2 (327.7) |
| 0.50 | 29.6 (329.1) | 53.5 (324.1) | 113.0 (323.5) | 226.9 (322.6) | 325.4 (329.1) |
| 0.70 | 70.0 (334.8) | 289.4 (332.4) | 614.1 (320.8) | 1090.6 (315.8) | 1708.6 (253.9) |
