
Figure 5.
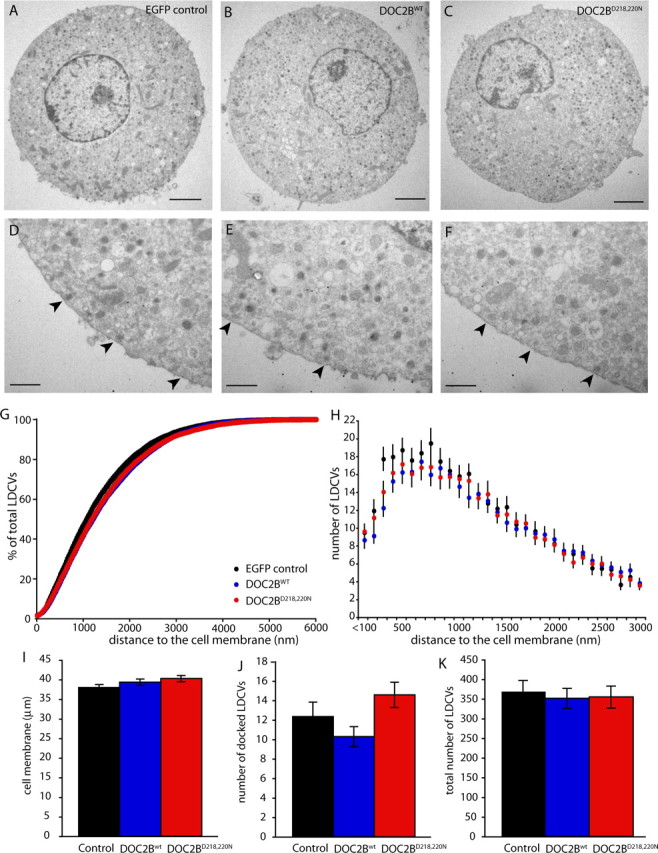
DOC2Bwt and DOC2BD218,220N do not alter the distribution of LDCVs. A–F, Typical example micrographs of adult mouse chromaffin cells expressing the EGFP control construct (A, D), DOC2Bwt (B, E), and DOC2BD218,220N (C, F). A–C, Example micrographs of the total cell. Scale bars, 2 μm. D–F, Detailed micrographs of the membrane area. Arrowheads indicate the morphologically docked vesicles. Scale bars, 500 nm. G, Cumulative distribution profile of the LDCVs as a percentage of the total number of LDCVs. H, Distribution profile of LDCVs per 100 nm bin distance to the cell membrane. I–K, In the cell cross sections, several parameters were quantified: the cell membrane length (I), the number of docked LDCVs (J), and total number of LDCVs (K). The data were calculated from n = 47 cells, N = 7 animals (EGFP control); n = 38, N = 8 (DOC2Bwt); and n = 28, N = 7 (DOC2BD218,220N). All error bars represent SEM.