
Figure 8.
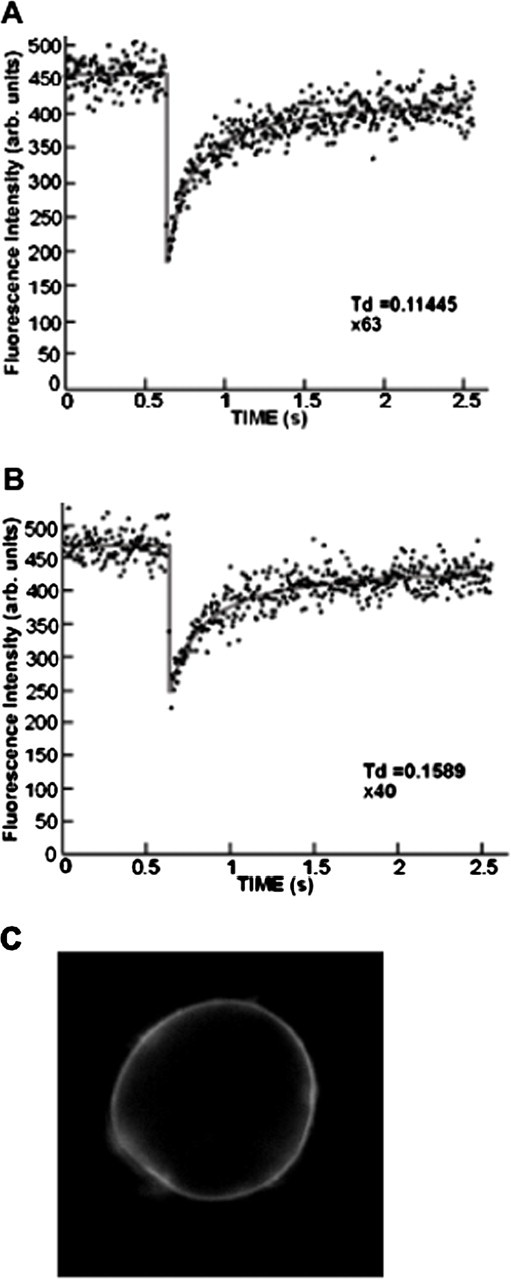
FRAP beam-size analysis of the PM interaction of DOC2BD218,220N-EGFP. FRAP experiments were conducted on chromaffin cells expressing DOC2BD218,220N-EGFP. A, B, Typical FRAP curves measured using the 63× objective (small beam size; A) or the 40× objective (B). Solid lines indicate the best fit of nonlinear regression analysis; the resulting τ and mobile fracture values are shown. The averaged time constants (τ) of FRAP measured were 0.09 ± 0.008 for the 63× objective (n = 37) and 0.16 ± 0.009 for the 40× objective (n = 36), suggesting direct interaction of the C2A domain of DOC2B with lipids or lipid-like proteins on the PM. C, Example of a chromaffin cell expressing DOC2BD218,220N-EGFP.