
Figure 1.
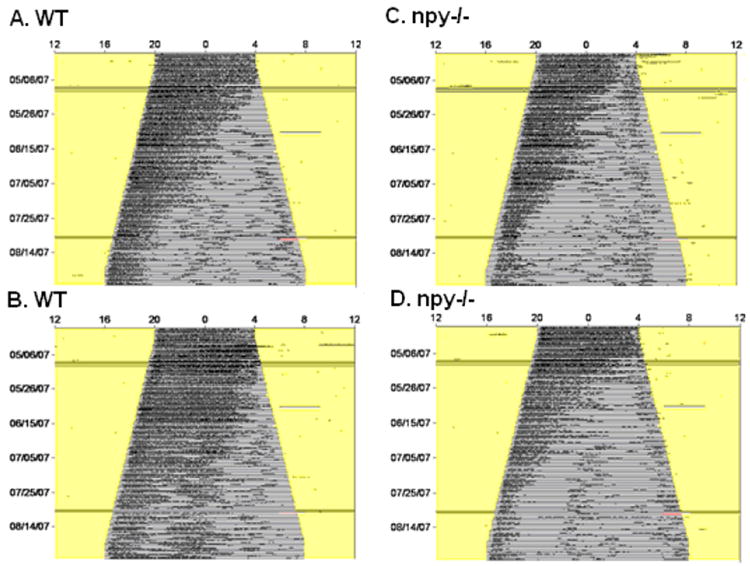
Representative actograms of WT (A and B) and npy-/- (C and D) mice. Actograms show days on the y-axis and 24 hours on the x-axis. The activity levels are marked by black bars and the number of wheel revolution is plotted in 6-min bins. The three black lines across each actogram indicate compute malfunctioning, but the light cycle was not affected by the computer problems on these days. Notice that activity of both groups started to fragment into smaller bouts as the day length gradually changed from LD 16:8 to LD 8:16.