
Fig. 1.
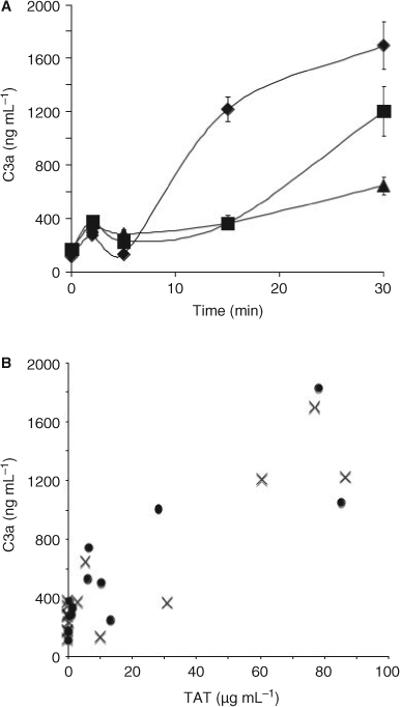
Clotting induced complement activation. (A) Generation of C3a in non-anticoagulated whole blood (diamonds), platelet-rich plasma (squares), and platelet-poor plasma (triangles), incubated in glass tubes. Data are mean ± SEM (n = 5). (B) Relationship between the generation of thrombin–antithrombin (TAT) (x-axis) and C3a (y-axis) in blood activated by incubation in glass tubes (crosses) or with thromboplastin (circles). Data points are means (n = 5).