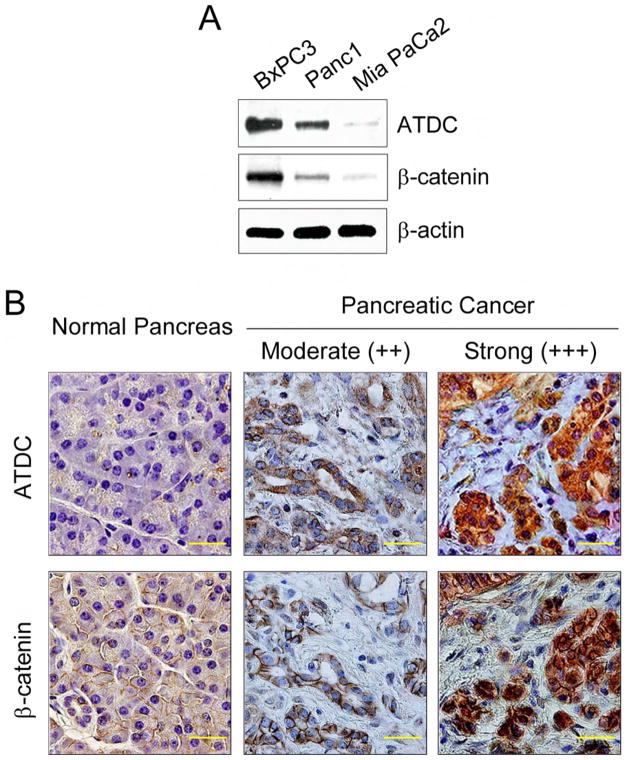
Figure 5. Correlation between ATDC and β-catenin expression in pancreatic cancer.
(A) Western blot analysis of ATDC and β-catenin expression in BxPC-3, Panc-1, and MiaPaCa-2 cells. β-actin served as a loading control. (B) Immunohistochemical (IHC) staining of samples of normal human pancreas (left panels) and human pancreatic adenocarcinomas (middle and right panels). A correlation between ATDC and β-catenin expression in pancreatic adenocarcinoma samples is evident. The scale bar indicates 50 μm. IHC scores are: moderate (++, intermediate intensity staining) or strong (+++, intense staining).

