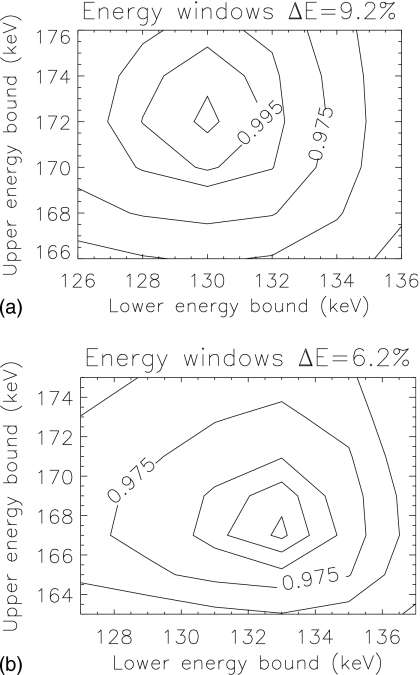
Figure 5.
Contour plots of normalized SNR2 as a function of the end points of the two energy windows (lower edge of the lower window and upper edge of the upper window), for the two energy resolutions investigated. The individual SNR results for each activity concentration estimation are multiplied to find the optimal windows. Contours are [0.900,0.950,0.975,0.990,0.995,0.999] of maximum.

