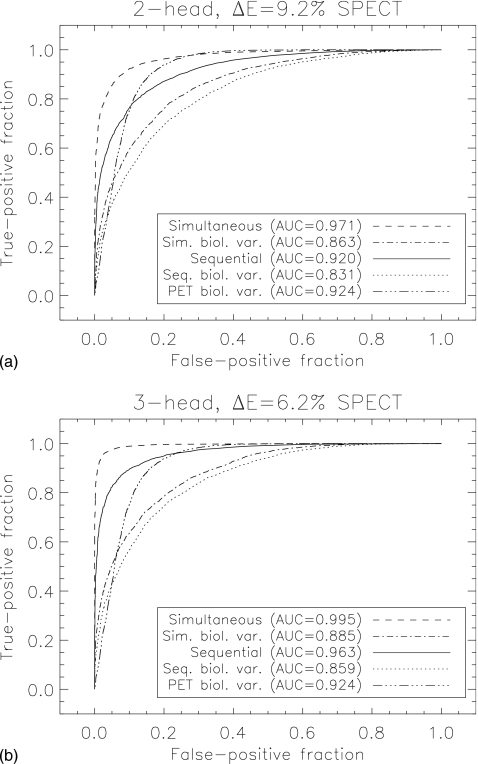
Figure 6.
(a) ROC curves for simultaneous and sequential imaging for a two-head, ΔE=9.2% SPECT system classifying subjects into normal or prodromal PD group. (b) Same, but for a three-head, ΔE=6.2% SPECT system. Both ideal system performance and performance including biological variability are displayed. PET performance with BV is included for comparison.

