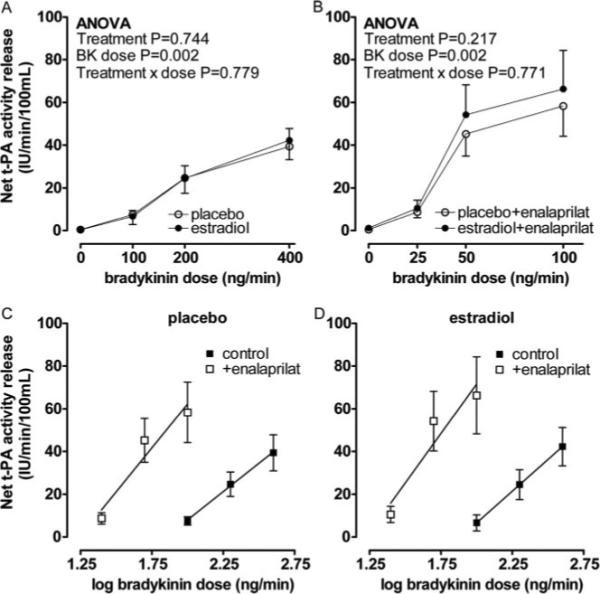
Figure 3.

Net release of t-PA activity in response to bradykinin (A), bradykinin plus enalaprilat (B) during placebo (○) and 17β-estradiol treatment (●). Probability values are for repeated measures ANOVA with pairwise comparisons between placebo and 17β-estradiol. Release of t-PA activity versus log bradykinin dose in postmenopausal women in the absence (■) and presence of enalaprilat (□) during placebo (C) and 17β-estradiol treatment (D).
