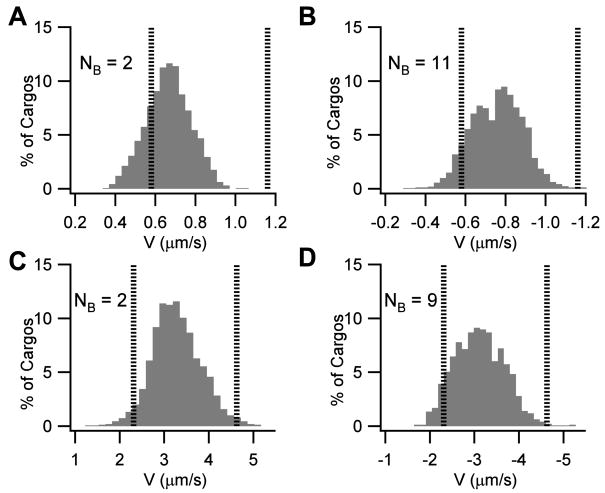
Figure 3.
Velocity distributions over fast axonal transport ranges. Anterograde transport by kinesin is represented by a positive sign convention while retrograde transport by dynein is represented by a negative sign convention. The distributions represent the average velocity of a population of cargos over the 4.74 second simulated period. The figure represents the minimum number of bound motors (NB) required to obtain a population of cargos whose average velocity is approximately centered at the average of the experimental ranges shown in Table 1. Vertical lines represent the edges of the experimental velocity ranges shown in Table 1. The ordinate indicated the normalized percentage of cargos which fall within each velocity bin. A. Anterograde populations of 1μm spherical cargos representative of the ‘bi-directional’ transport range of ~0.58–1.16 μm/s (e.g. 50–100 mm/day) require greater than 2 bound kinesin motors per cargo. B. Retrograde populations of 1μm spherical cargos representative of the ‘bidirectional’ transport range of 0.58–1.16 μm/s (e.g. 50–100 mm/day) require 11 bound dynein motors. C. Anterograde populations of 200 nm spherical cargos representative of the fast transport range of ~2.31–4.63 μm/s (e.g. 200–400 mm/day) is obtained by a minimum of 2 bound kinesin motors per cargo. D. Retrograde populations of 200 nm spherical cargos representative of the fast transport range of ~2.31–4.63 μm/s (e.g. 200–400 mm/day) is obtained by a minimum of 9 bound dynein motors per cargo.

