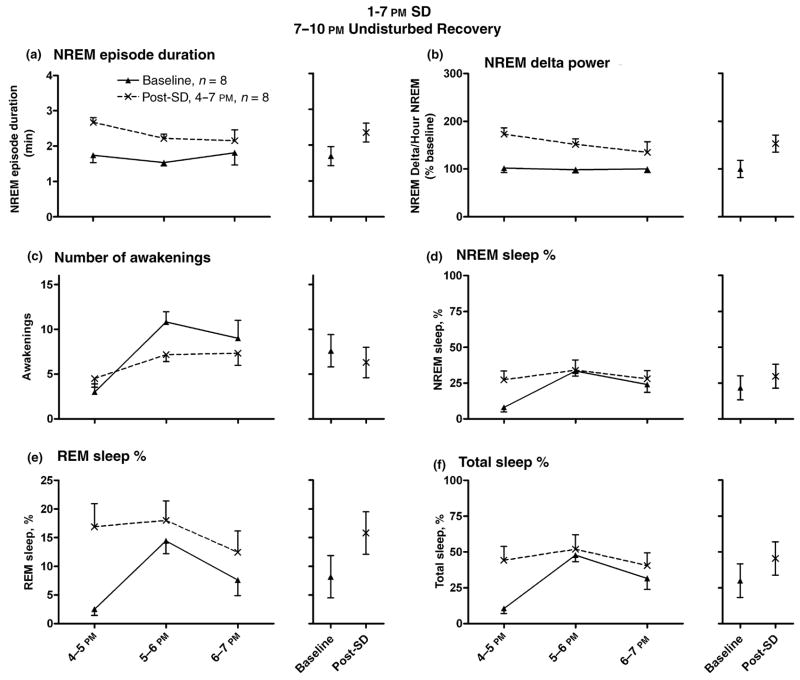
Figure 4.
EEG measures indicated sleepiness during undisturbed recovery following sleep deprivation (SD, 1–7 PM), with recovery in the dark period (7–10 PM). Light/dark cycle was 7 AM/7 PM, n = 6. NREM sleep episode duration (Panel a; 1 min, 41 s baseline to 2 min, 21 s post-SD) and NREM delta values (Panel b; 153% elevation post-SD compared to baseline) were elevated in the recovery period. A non-significant decrease in the number of awakenings per hour was noted (Panel c). Panels e and f demonstrate significant increases in the hourly amounts of REM (from 8.2% baseline to 15.8% post-SD), and total sleep time (from 30.0% baseline to 45.5% post-SD), expressed as percentages of total time per hour. NREM sleep % demonstrated a non-significant increase (Panel d; from 21.8% baseline to 29.7% post-SD). The data plotted are mean ± SEM. To the right of each comparison is the calculated mean for the 3 h of recovery for each treatment (baseline versus post-SD), as well as 95% confidence intervals. Each animal was used as its own control.

