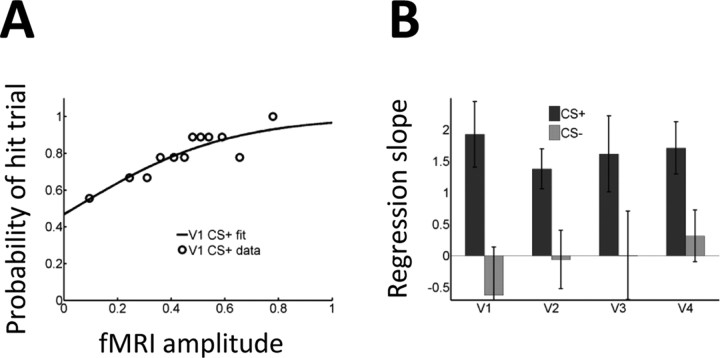
Figure 7.
Logistic regression analysis with hit and miss trials. A, The probability of a hit trial as a function of fMRI single-trial response in V1 was modeled via a logistic regression analysis for data from a representative individual. The regression slope indicates the strength of the predictive effect. B, Regression slopes averaged across the group indicated a stronger relationship during CS+ trials. Error bars indicate SEM.

