
Figure 8.
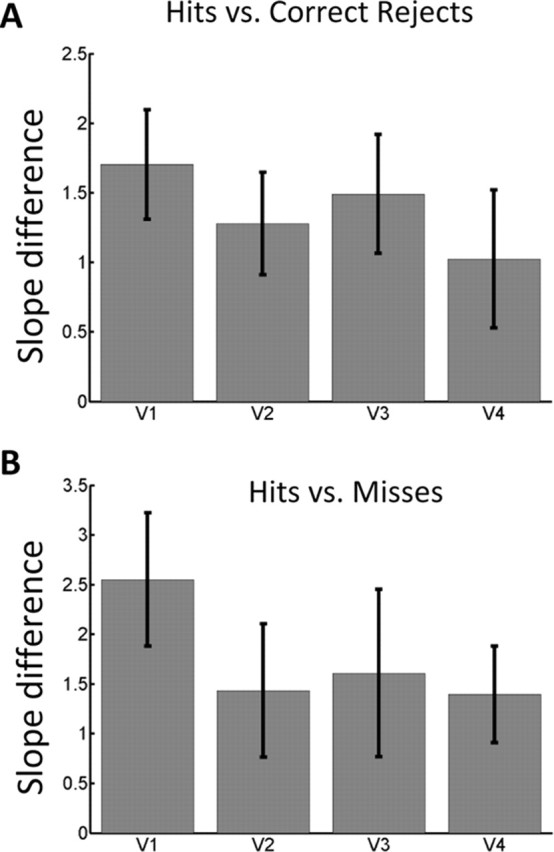
Comparison across V1–V4. A, B, The difference in logistic regression slopes is shown for the analysis of hits vs correct rejects (A) and hits versus misses (B). The relationship between fMRI responses and behavior appeared to be strongest in area V1 (see Results). Error bars indicate SEM.