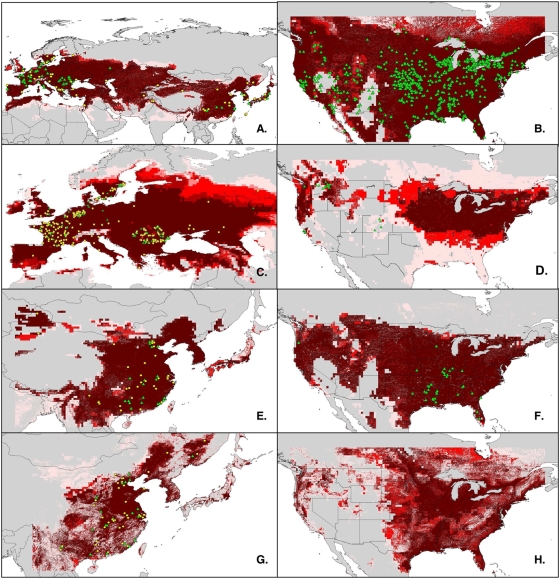
Figure 1. Niche models in native ranges and in the United States.
Ecological niche models for common carp (A, B), tench (C, D), grass carp (E, F), and black carp (G, H) on native and U.S. landscapes. Shading indicates the predicted suitability predicted (brick red = 7–10 models, canary red = 4–6 models, pink = 1–3 models). Occurrence points for each species are shown as training data (yellow circles) in the species' native range (A, C, E, G) or independent validation data (green triangles) in the native or introduced ranges (B, D, F, H).

