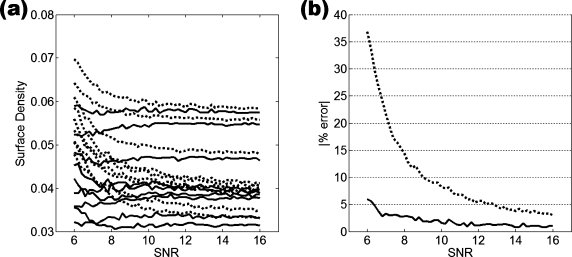
Figure 9.
Correction for varying SNR of surface density and correction accuracy: (a) surface density before correction (dotted line), corrected surface density (solid line); (b) error in surface density calculation induced by noise (dotted line) and after correction (solid line). The error in the corrected values is lower than the errors in the original values, and in the SNR range of 8–10 it is lower by approximately 10% of the noncorrected surface density values.

