Abstract
The x-ray light valve (XLV) is a novel, potentially low-cost, x-ray detector that converts an x-ray exposure into an optical image stored in a liquid crystal cell. This optical image is then transferred from the liquid crystal cell to a computer through an optical-to-digital imaging readout system. Previously, CCD-based cameras were used for the optical readout, but recently it was proposed that an inexpensive optical scanner, such as an office document scanner, is a better match to the optical properties of the XLV. A methodology for characterizing a document scanner’s ability to produce medical quality images from the XLV is outlined and tested on a particular scanner (Canon LiDE 30). This scanner was shown to have key characteristics of a medical device—a linear response, dynamic range sufficient for chest radiography (although not mammography) in a single pass, and an MTF and NPS that exceed the requirements for all medical applications of the scanner. This combination of criteria shows that a document scanner can be used as a digitization method for the XLV.
Keywords: x-ray light valve, digital radiography, readout, scanner
INTRODUCTION
The x-ray light valve (XLV) system1 is being developed as a high-quality digital x-ray detector with potential to be produced at significantly less cost than existing digital systems.2, 3 These properties make it suitable for deployment in developing countries as well as increasing the availability of digital detectors to rural areas and small hospitals.
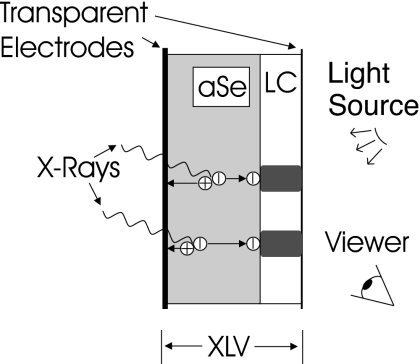
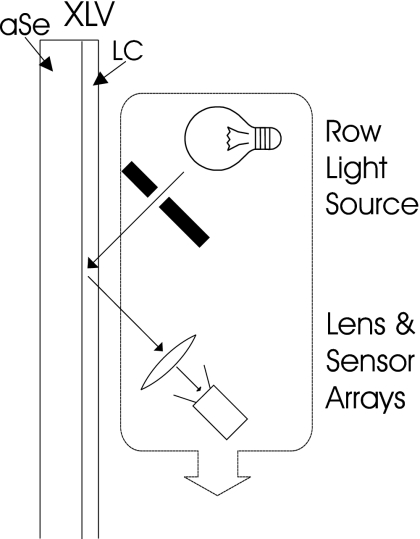
The XLV is composed of a liquid crystal (LC) cell constructed directly on an amorphous selenium (a-Se) layer.3 Its operation2 can be described in the following steps (see Fig. 1). A high potential difference is applied to the bias electrodes, creating a strong electric field in the photoconductive a-Se. The XLV is then exposed to x rays that create electron-hole pairs in the a-Se, which are separated by the field, which pulls them to the surfaces of the photoconductor. After the x-ray exposure is completed, the bias potential is removed. The charge carriers at the interface between the a-Se and the LC create a spatially varying electric field in the LC, resulting in an instantly visible image in the LC cell. In a key improvement from previous approaches,3 where the image decayed rapidly with time, current XLV construction techniques allow the x-ray induced charge image, and hence the LC image, to be retained semipermanently until erased.2 The visible image is read out optically in either a transmissive or reflective configuration.2 Finally the XLV is erased, preparing it for a new exposure.
Figure 1.
Operation of the XLV (not to scale). A high potential is applied to the electrodes biasing the a-Se layer. The XLV is then exposed to x rays, creating electron-hole pairs, which are pulled apart by the field, and drift to opposite surfaces. When the exposure is completed the bias is removed, leaving an image charge that creates, within the LC cell, an image viewable with external illumination.
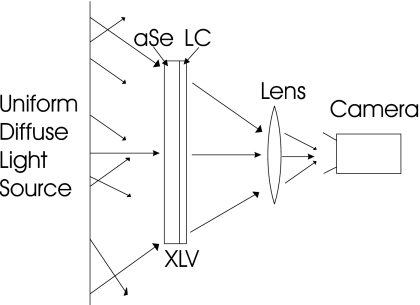
The simplest type of optical readout is the transmissive configuration, illustrated in Fig. 2, which was used in our initial proof of concept experiments.3 In this configuration the illumination is on one side of the XLV with the camera on the other side, and thus the readout light shines through both the a-Se and the LC. A serious disadvantage of this approach is that the light will be transmitted through the LC at different angles from one position to another, thus creating different viewing angles for the camera depending on the location in the image, as shown in Fig. 2. Since the transmission characteristic of LC cells vary with viewing angle,4 for the same level of charge at different viewing angles to the camera, the camera will register different shades of gray, creating a nonuniform image intensity across the digitized image for a uniform input.
Figure 2.
A transmissive model of XLV readout. After the latent x-ray image is generated, it is read out by shining light through the XLV from a uniform, diffuse light source. Only those rays from the source which after passing through the XLV are incident on the front glass of the lens are imaged by the camera. It can be seen from the diagram that the angle of the light collected by the lens varies consistently across the image plane.
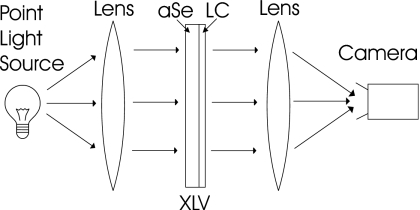
To achieve consistent gray levels across the image a constant viewing angle must be used. One possible approach is to use collimated light. For example, one lens can be used to create collimated light to shine through the XLV, while a second lens focuses that light onto an area camera, thus imaging the complete XLV (Fig. 3). Unfortunately, this configuration would be impractical for a real world clinical detector due to the size of the optics, which need to be at least as large as the XLV. Further, the optics in front of the XLV would both attenuate x rays and require the placement of the patient to be far from the detector.
Figure 3.
A transmissive and collimated approach to XLV readout. After the latent x-ray image is generated it is read out by shining light through the XLV. A large lens the size of the XLV collimates light, ensuring that the light goes through the XLV at a uniform angle. A second lens of the same size focuses it onto the camera.
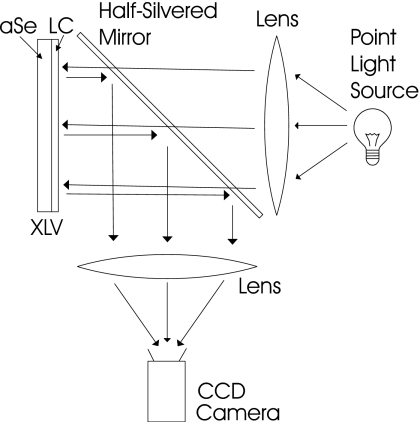
Some of these problems can be eliminated by the use of a reflective rather than transmissive configuration. In this case readout light is incident on the XLV from the LC side, and reflected at the a-Se∕LC interface onto an area camera on the same side of the XLV as the illumination. This method inherently removes all optics from the patient side of the XLV, which permits bringing the patient as close as is required to the detector, while also making it possible to entirely isolate the a-Se layer from the readout light. In this approach (depicted in Fig. 4) the optical path is constructed with two large lenses and a half-silvered mirror: light is collimated by the first lens, passes through the half-silvered mirror, reflects off the XLV, reflects off the half-silvered mirror, and is focused by the second lens onto an area camera. Though it is an improvement, the reflective approach using an area camera is not a complete solution since it would still be bulky due to the large optical components, creating a heavy and cumbersome device which would be both difficult and costly to manufacture.
Figure 4.
A reflective model of XLV readout. After the latent x-ray image is generated it is read out by reflecting light off the XLV. Light is collimated by a lens, goes through a half-silvered mirror, reflects off the XLV, reflects off the half-silvered mirror, and is focused onto a camera.
However, introducing the concept of a line-by-line optical scan to the reflective configuration can result in a much more practical, compact, and lightweight readout method as shown in Fig. 5. This method uses a linear light source and a linear sensor which are moved together across the XLV to scan the entire image one line at a time. Such a readout device has the benefit of being simple and will meet the requirement of always shining light through the LC at a fixed angle, hence eliminating image nonuniformity, without requiring large optical equipment. The mechanics and optics required by this method already exist and can be adapted by modifying a standard office document scanner.
Figure 5.
A reflective scanning model of XLV readout. After the latent x-ray image is generated it is read out by a linear sensor array and light array that move across the XLV.
Thus, a reflective method based on a scanner is our preferred choice for an XLV readout system. However, the quality of commercially available scanning systems needs to be understood. The goal of this article is to create a methodology for evaluating raw scanner properties, including the characteristic curve of the detector, dynamic range, resolution, and noise power spectrum. These methods are then applied to evaluate a particular scanner. Testing is performed using an off-the-shelf scanner not yet modified for operation with the XLV device. This was done to establish the feasibility of an optical scanner as a device to read out medical images regardless of the image formation mechanism. A scanner designed for use with an XLV may require modifications such as replacing LEDs with those having carefully chosen wavelengths and power as well as careful alignment of the XLV and scanner to ensure optimal performance. These optimizations and any resulting changes to scanner properties will be discussed in later publications. The results for an off-the-shelf scanner are then critically compared to the requirements of digital x-ray systems to evaluate the potential of an XLV∕scanner system for clinical radiography.
SCANNER TECHNOLOGY
Document scanners create a complete image of an original by collecting diffusely reflected light from a piece of paper illuminated one line at a time. The sensors in current scanners are based on CCD or CMOS technologies. CCD sensors are smaller than the width of a page, which requires complex demagnifying optics to match one line of the paper original to the CCD. By comparison newer CMOS based devices, often referred to as contact image sensor (CIS) technology, extend the sensor to the full width of the page, which allows the use of simple 1:1 optics. Therefore, the CIS technology is more amenable than CCDs to customization and of greater applicability to XLV readout. Since all CIS scanners operate in a similar manner, we will concentrate on one particular scanner as an example.
The scanner investigated was a CIS-based document scanner, the Canon CanoScan LiDE30. It has a pixel pitch of 1200 dpi (dots per inch), with detector element (del) centers spaced 21 microns apart, with 8-bit standard output, 16-bit optional output, a 16 bit internal analog to digital converter, and internal pixel gain and offset correction functions.
Optics
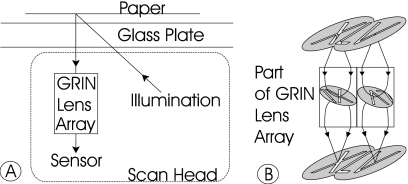
The primary optical components of a CIS scanner (Fig. 6) are a light source that evenly illuminates a line on the original scanned object, a lens array that transfers an image of the illuminated line to the sensor (image) plane, and the CIS sensor, which captures the light, converting it to an electronic signal. The optics move relative to the paper, digitizing sequential lines of data, to create a complete image of the paper original.
Figure 6.
(A) Light path of the scanner: A light source sends light through a sheet of glass, which diffusely reflects off a sheet of paper. It then goes back through the glass, where it is focused through a row of GRIN lenses and onto an array of sensors. (B) The row of GRIN lenses is made of transparent plastic with a radially varying index of refraction. The lens array curves the light, forming a real inverted image inside the lens and a real upright image on the sensor.
The light source functions by shining one of three LEDs (red, green, and blue) onto a light pipe that has a shape designed to catch and emit light in an evenly illuminated line. The light is unfocused, and illuminates a swath around the scanned line on the paper original. A thin sheet of glass called a platen supports the paper, keeping it a uniform distance from both the light source and the sensor.
The image of the illuminated line on the paper is transferred in a 1:1 ratio onto the sensor through an array of gradient indexed (GRIN) lenses. This array consists of two staggered rows of GRIN lenses, with a 0.32 mm spacing, occupying the width of the scanner. GRIN lenses, shown in Fig. 6B, consist of transparent plastic rods embedded in an opaque black plastic matrix. The rods have an index of refraction that varies continuously in a radial direction, starting at the central axis of the cylinder, such that a real inverted image exists inside the lens, halfway between the top and bottom of the lens, and a real upright image appears on the sensor plane. The properties of the lenses, including the upright image, the overlapping fields of view, and a 1:1 magnification, create a continuous image on the sensor.
The sensor consists of a row of small light sensitive sites or detector elements (dels) to convert the light to electric charge. Each del is coupled to its own buffer to which it transfers its charge once per line for subsequent readout. This insures very low dead time during readout. The dels are spaced equidistantly along 11 long, thin rectangular integrated circuits (ICs) that are arranged end to end. Where two ICs meet there is a gap approximately equal to the width of a del. These ICs are attached to a circuit board, wire bonded to electrical connections on the circuit board, and enveloped by a transparent protective coating that protects the ICs and their wire bonds.
Mechanics
The optics, sensors, electronics, and a stepper motor are all mounted on a single composite structure or scan head that is connected electrically via a flexible ribbon cable to a USB port on the body of the scanner. The USB connection provides both power to supply all the components of the scanner and a data connection for control and image data transfer. The scan head rests on a metal guide, running along the length of the scanner, and uses a stepper motor to pull itself along a toothed rubber belt. This motion is what moves the line reading optics along the original, allowing it to capture multiple lines and form a complete image. After the completion of an image, the scan head seeks a home position that is determined by moving the scan head back towards its original position until an opto-coupler is interrupted. To scan a new image, the scan head moves a set number of rows from the home position to a start point and then moves a set number of rows to an end point and finally resets by seeking home.
The readout across the width of the scan head is referred to as the fast scan direction; the readout along the axis of scan head movement is referred to as the slow scan direction. In order that the final image is square with isotropic pixels, the distance that the scan head moves per line is made equal to the width of a del in the fast scan direction. The system aperture (blur) is given by the width of the del in the fast scan direction, and by the convolution of the del length with the distance of scan head travel for the slow scan direction.
The rate of the array readout to the controlling computer determines the maximum possible speed of the physical scan movement. If it exceeds this speed, the scanner will be forced to stop, reverse, reposition, and then continue the scan from where it stopped once the data cache is emptied. These reversals can cause mechanical backlash, i.e., a shift of the sensor within the scan head, which may result in a misalignment image artifact such as skipped or duplicate lines. These image readout problems can be avoided by ensuring that the scan parameters match the computer’s capabilities within an appropriate error margin so as to avoid scan reversals.
Operating software
Manufacturers of document scanners provide user-friendly document scanning software that controls the operation in a manner which may well be suboptimal or inappropriate for a medical device. The scanner used here has a custom-designed, integrated circuit scanner controller (National Semiconductor LM9833 IC) that accomplishes all scanner functions. By examining the IC datasheet, custom software was developed to control all the features of the scanner and to build up a practical control interface specific to our medical application.
Calibration
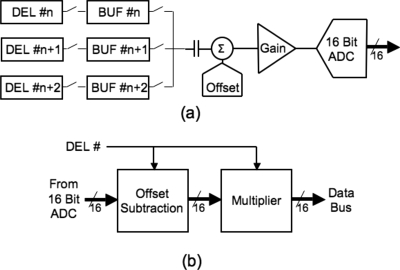
The illumination of the row of individual dels may be uneven, possibly caused by imperfections in the lightpipe, lens optics, or by dust particles. Also, individual dels may not convert light to electrons with the same efficiency (due to geometrical and intrinsic properties). This creates the net result of a fixed pattern image output in the fast scan direction that takes the form of stripe artifacts parallel to the slow scan direction. Therefore, the scanner incorporates a calibration routine designed to correct for this problem. First, to avoid clipping and to use the full range of the analog to digital converter (ADC), a global offset (Cgo) and gain (Cgg) is calculated and applied to the analog signal coming from the del buffers [Fig. 7a]. Second, separate digital offset (Cxo where x is the del number, i.e., an index in the fast scan direction) and digital gain (Cxg) values are calculated for each del and stored by the IC for subsequent use. These values are then applied to the digital readout values from the corresponding del [Fig. 7b]. The data for all offset and gain values are acquired during the calibration process by scanning uniformly black and white strips, respectively, that are permanently mounted in the scanner body.
Figure 7.
Diagram of the processing of del input signals. (a) Global offset and gain: The analog signal from all dels are serially processed using the same offset and gain corrections for every del before being converted to a digital signal. (b) Pixel specific offset and gain: Digital signals are processed with an individual offset and gain, each specific to the del which is being read out.
METHODS AND MATERIALS
Throughout these experiments the scanner was operated with specific settings held constant except where noted. These settings were grayscale mode using only the red LED, resolution of 1200 DPI, bit mode at full 16 bits, and a Cgg value of unity. Cgo was set to varying values depending on the experiment. When a scan did not use calibration, then an uncalibrated scan was instead obtained, where all Cxo are set to 0 and all Cxg are set to 1.
The output of the scanner, an array, is defined as P(x,t). The dels, x, are read out in the slow scan direction and are referred to as a row in the array. The value of t is an index in the slow scan direction, and is referred to as a column in the array. t is a temporal index since the successive rows of x are read out in temporal sequential order, but when the scan bar is in motion it also indicates spatial movement across the paper original and we can obtain P(x,y), where y=vt+y0, where y is a spatial index and v is the speed of the scanbar. When scans were obtained with the scanbar stationary, or static scans, then v=0, y=y0, and P(x,t) is a function of only x and t.
The input to the del, the amount of light received, is controlled by varying the length of time an LED is turned on per readout cycle. This creates stepped fractional exposure levels, w, ranging from 0% to 100%, with the maximum exposure of 100% corresponding to an LED on time of 10 ms per cycle, which is equivalent to continuous usage.
Detector response
The detector response of the scanner characterizes the nature of the output P, including its relationship to exposure (w), the variance with time and position, and any temporal changes. This is tested by analyzing the results of a single experimental procedure in three different ways. The experimental procedure was several realizations of P(x,t) acquired with w stepped from 0% to 49% at intervals of 2.45%. The use of static scans eliminates the effect of fluctuations in the reflectivity of the scanned surface (in this case the white scanner cover.) The scanner was set such that t was large enough to make the mean of measurements for one column of P(x,t), statistically precise to better than one ADU (analog-to-digital unit).
P(x,t) was then analyzed for three different purposes. First, the characteristic curve of the system was obtained by choosing a typical del, and plotting its mean, Eq. 1, against w,
| (1) |
Second, changes in detector output over time were determined by examining the mean of arbitrary intervals in t, with w fixed at 44%. Using intervals in t of 125 rows of the image matrix allows changes of the mean in t to be viewed with a minimum of noise, and allows the expression of the mean, Eq. 2, to be formed,
| (2) |
where T is a larger time index {0,1,2,…,78} representing t {1–9900}∕125. is then plotted against T.
Third, to obtain the noise level of the scanner, P(x,t) was first corrected for the temporal drift measured in the second analysis. A vector, Pdiff(x,t), was generated corresponding to the difference between the mean and the drift in time . The variance, σ2(x), was then calculated as per Eq. 3 and plotted against the mean , for different w,
| (3) |
Noise power spectrum
Noise power spectra (NPS) are used to describe the noise response of a system as a function of spatial frequency, fs, and temporal frequency, fτ, and will be used to identify the sources of noise in the readout system. To achieve this analysis a flood-field area image P, wherein the incoming light is as uniform as possible, is acquired by scanning a sheet of premium glossy photo paper that has substantially smoother fine grain than normal grade paper. The NPS data, Pa–e, was acquired under various different operating conditions, listed in Table 1 as experiments a through e, each creating different combinations of noise and interference components so that they could be isolated and identified.
Table 1.
Measurements performed to establish NPS.
| Experiment | Bit mode (I)1 | Pair wise corrections (II)2 | Motion (III)3 | Fractional light exposure-W (IV)4 | Offset in Hex-Cgo (V)5 |
|---|---|---|---|---|---|
| (a) Dark | 16 | Yes | None | 0% | 0×10 |
| (b) Dark and motion | 16 | Yes | Yes | 0% | 0×10 |
| (c) Bright and motion | 16 | Yes | Yes | 36% | 0×00 |
| (d) Standard conditions | 8 | Yes | Yes | 57% | 0×00 |
| (e) No spatial correction | 16 | No | Yes | 36% | 0×00 |
(I) Bit mode is set in scanner controls and determines the bit depth of the data exiting the scanner.
(II) Pairwise corrections are applied to remove spatial noise.
(III) Motion indicates whether the motor is active.
(IV) Fractional light exposure indicates how much light was used. At 0% [(a) and (b)] the source was off, for bright scans [(c), (d) and (e)] the fractional light exposure was set to target a mean ADU readout value of 80% of saturation, the actual settings varied to account for timing differences in 8 or 16-bit mode.
(V) The global offset was configured so as to avoid clipping in dark scans.
Pa–e(x,t), was then analyzed on a per row basis, i.e., for fixed t. To remove spatial artifacts, pairs of rows, t and t+1, were subtracted from each other, and a Fourier transform was performed on the result. The Fourier data were squared and then averaged in the slow scan direction, yielding the NPS. Since this analysis method was designed to remove spatial artifacts, a separate analysis was performed on Pe(x,t) without pairwise subtraction to obtain data with the fixed pattern spatial noise included so that it could be subsequently isolated.
Resolution
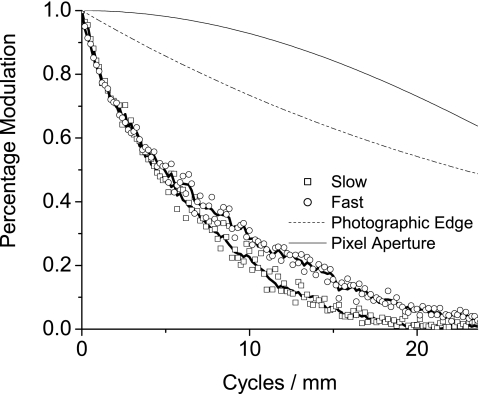
The resolution of the scanner was determined by measuring its modulation transfer function (MTF), using the slanted edge method.5 This method was selected because of its ability to spatially oversample, which allows measurement of an MTF that exceeds the Nyquist frequency and has the added advantage of averaging out residual stripe artifacts and noise. The edge used was a photographic chart (the ISO-16067-1 Target, manufactured by Applied Image Group) produced specifically for measuring scanner properties. It contained a square, with a small angular off-axis rotation, designed for measuring MTF. The chart, however, does not have a perfect MTF and a correction was performed using the chart manufacturer’s calibration, which is plotted with the result in Fig. 13. Both edges of the square were scanned, allowing the MTF to be measured in both the slow and fast scan axes.
Figure 13.
The modulation transfer function (MTF) of the scanner is shown in both the fast scan and slow scan directions. In each direction both averaged data and data created by the condition that the ESF be monotonically increasing are included; the data are corrected for the imperfect MTF of the photographic edge. For comparison, the MTF of a sinc function and the photographic edge used in measurement are shown.
Sixteen scans of the photographic target were taken and coarsely aligned using the fiducials on the chart to correct for the positional offset between scans. These images were then cropped into smaller images containing only a vertical or horizontal edge, and then processed into an edge spread function (ESF).5 The resulting 16 ESFs were more finely aligned, by finding the point of minimum difference, and then averaged. The averaged ESF was differentiated into a line spread function (LSF) which was Fourier transformed. The modulus of the Fourier transform was taken and normalized to unity at f=0 to yield the MTF. Lastly, the MTF was corrected for the MTF of the test chart edge, yielding final MTFs for both the slow and fast scan directions. To reduce noise and provide a smoother MTF, the average ESF was also processed with the condition that it be monotonically increasing,6 and then converted to an MTF.
RESULTS
Characteristic curve
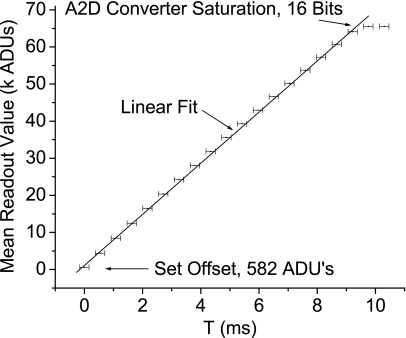
The characteristic curve, Fig. 8, shows the relationship of for varying w, plotted with a best fit line. The difference between and the population mean is less than 1 ADU in 216 (65 536); the error in w, due to computer clock timing imperfections, is shown in error bars on the graph. The analog to digital converter saturates at 16 bits as shown on the graph. The ordinate intercept of the graph, approximately 580 ADUs, represents the readout offset (Cro).
Figure 8.
For a given light intensity, controlled by a timed exposure of duration T, the resulting del readout is given. The relationship is clearly linear as shown by a best fit line added to the graph. The lowest displayed value is set by a software offset while the highest value represents saturation in the analog to digital converter.
Temporal curve
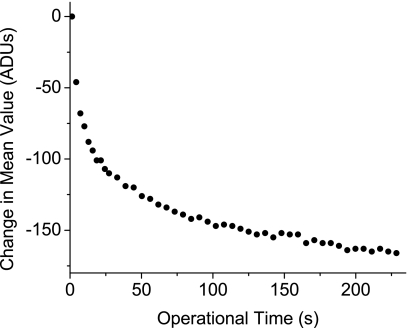
In Fig. 9, a graph of the scanner’s mean output over time, the curve shape is qualitatively similar to an exponential decay. The output, , drops ∼80 ADU or 0.13% of the mean signal, in the first 10 s, and drops to twice that value, ∼160 ADU after 200 s.
Figure 9.
The del mean readout value decreases with time as the dels are read out continuously and approaches an asymptote after 200 s. t is the operational time from when the scanner starts a readout; I0 is the mean readout value a t=0, and I is the progressive mean readout values at successive t.
Standard deviation
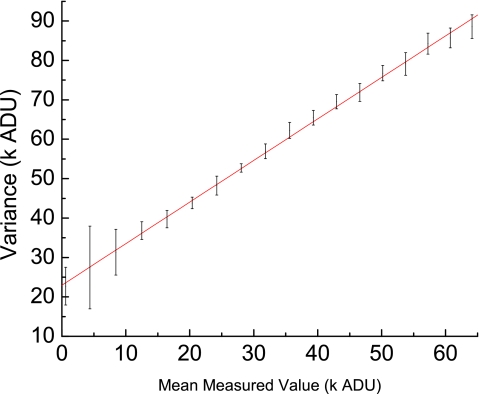
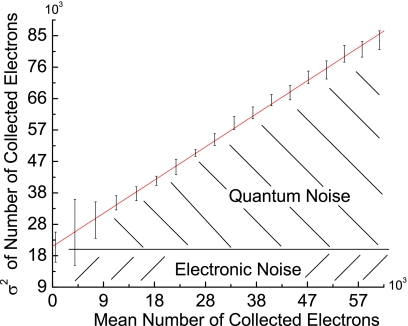
In Fig. 10, σ2P is plotted against with a fitted line added to the graph for comparison to a linear fit. The ordinate intercept of ∼23 000 ADU (Ref. 2) represents the square of the electronic noise, yielding a value for the electronic noise offset, Cen, ∼150 ADU.
Figure 10.
For a given exposure level the del’s noise response is measured using its variance and plotted against the mean signal for that exposure. The response appears to be linear, showing that the majority of the noise is quantum noise.
Noise power spectrum
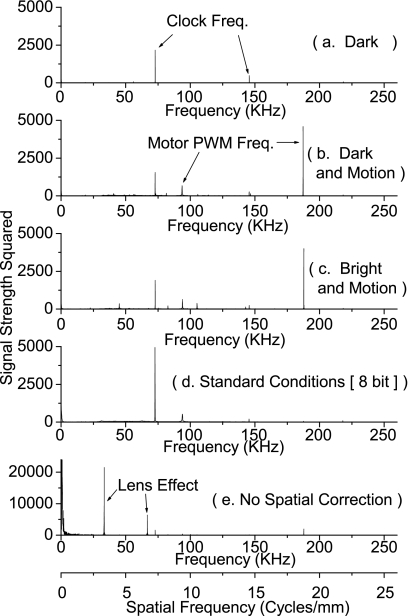
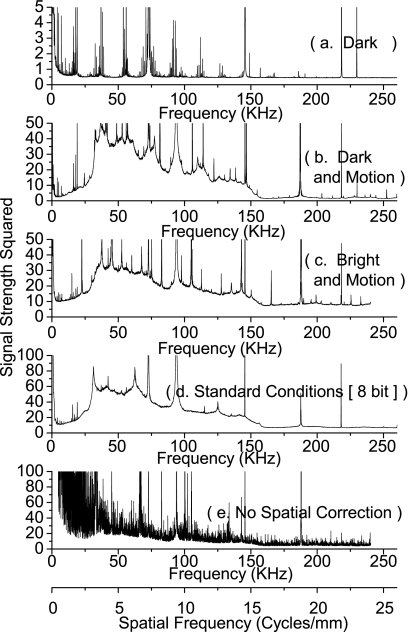
The NPS are displayed in Figs. 1112. The entire range of the signal strength squared is plotted on a linear scale in Fig. 11 to show the location of the peaks and accompanying harmonics. The data are replotted in Fig. 12 on a linear scale with the peaks clipped in order to show the shape and frequency dependence of the NPS. The simplest condition (scanner bar stationary, no illumination), Figs. 1112a, showed predominantly white noise, and one set of harmonic peaks at fτ=73 kHz, and fτ=146 kHz. Comparatively, the spectra that were obtained with the scanbar moving, Figs. 1112b (dark and motion), had significantly more noise. The lower frequencies no longer showed white noise, and there was a clear peak at fτ=187.25 kHz, and accompanying harmonics.
Figure 11.
The noise power spectrum is sampled under five different conditions. The results measure three distinct types of noise: from the motor at 187.25 kHz, the electronics clock at both 144 and 72 khz, and the lenses at 3.28 cycles∕mm. The motor’s pulse width modulation operates at a frequency of 187.5 kHz, creating a cyclical power draw on the voltage rails, which is a very good match for the observed noise at 187.25 kHz. The electronics is driven by a clock operating at a frequency of 48 MHz, which is equal, within error, to 333*144 kHz, and 666*72 kHz. This shows the effect of either a component operating at around a 333rd of the clock frequency, or the effects of a highly aliased clock signal. The lens noise is at a frequency of 3.28 cycles∕mm, and arises from the regular spacing of the lenses.
Figure 12.
The noise power spectrum from Fig. 11 is graphed in a lower range to show the changes in the baseline of the noise. In part (a), where the only major source of interference is the system clock, the baseline is relatively flat. The addition of the use of the motor in (b) adds a large amount of midfrequency noise, significantly distorting the baseline. The addition of light, in (c), smoothes the NPS since it adds noise to all spectra. Condition (d) has a baseline with a similar frequency distribution, but a larger power then (c). Finally in (e), where no spatial correction is used, a strong amount of low-frequency noise appears that is due to fixed patterns in the optics.
Illumination was added for Figs. 1112c (bright and motion) and the results were nearly identical to Figs. 1112b, with only a small increase in amplitude of the harmonics of the fτ=73 kHz interference. The experiment for Figs. 1112d (standard conditions [8-bit]), differed from Figs. 1112c only in the bit mode of the scanner, and produced results that differed only by the absence of the fτ=187.25 kHz fundamental signal but not its harmonics. Lastly, the NPS analysis was performed without pairwise subtraction, Figs. 1112e (no spatial correction). It showed a signal not present in any other analysis—a clear peak at fs=3.28±0.01 cycles∕mm. Since this peak was present only in the analysis that did not remove spatial artifacts, it must be spatial in nature.
On direct visual observation of scans as images, some of these noise sources are clearly visible. The spatial noise of fs=3.28 cycles∕mm is clearly visible as stripes in the slow scan direction, in any uncalibrated P(x,y). Further careful examination of calibrated scans shows the existence of the fτ=187.25 kHz noise as a fixed pattern in random regions of P(x,y).
Resolution
The fast and slow scan MTFs, Fig. 13, include averaged data plotted as points, and a line representing data that was additionally smoothed using the condition that the ESF was monotonically increasing. The figure also includes the aperture response for the width of a pixel, as well as the MTF of the photographic edge used to generate the data. The MTF of the slow scan direction dropped to 10% at 14 cycles∕mm, and approached zero near the Nyquist frequency. Meanwhile, the fast scan direction MTF decreased to 10% just past 17 cycles∕mm and was still nonzero at the pixel sampling Nyquist frequency of 23.6 cycles∕mm.
DISCUSSION
Characteristic curve
From the characteristic curve in Fig. 8 it is evident that the detector, within the computer timing error of 0.16 ms, responds linearly, simplifying all further analyses. It is important to realize, however, that scanners do have look-up tables, as well as individual pixel correction tables (as shown in Fig. 7), that when used and set incorrectly could make a linear system appear to behave nonlinearly.
Temporal response
As shown in Fig. 9, the mean readout value, , drops as T increases, approaching an asymptote. This drop begins at the start of a readout cycle regardless of any warmup used prior to readout. This drop could not be due to a dimming in the light due to LED effects, since the LEDs are left at the same duty cycle before and after scanning, as they are during data acquisition. The shape of the temporal response curve is, however, consistent with a change in the output of the power supply. This likely corresponds to a stabilization curve caused by the additional electrical load from a component that is only switched on during readout at t=0. An improved dc electrical supply could possibly remove this effect.
This drop in , because it exists in the slow scan direction, is not corrected for by the built-in calibration, which only corrects output values in the fast scan direction. Instead a correction, based on the experimentally obtained curve, can be applied to P. This correction was only relevant to the measurement of σP, as it is the only analysis that examined the range of variation in t, and therefore a correction was required to get an accurate measurement.
When creating medical images a similar process can be envisaged to correct for this phenomenon. First, the scanner would be warmed up using a delay time during which an insignificant region is scanned before reaching the imaged area. Second, a filter would have to be applied to the whole region to account for the remaining drop. This will not affect the SNR of brighter regions of images, but at areas of minimum exposure this might cause SNR degradation proportional to the size of the drop. For example, if a scan had a delay time of 60 s built in, the subsequent drop would be about 40 ADU. At the low end of the exposure spectrum, the least significant bit is equivalent to 256 ADU, and therefore the drop affects up to 15% of the signal. This noise however will still be dominated by the electronic background noise which occupies greater then 50% of the signal.
Noise interpretation
Dynamic range
The system noise can be broken down into two types of noise: (1) that which does not increase with signal, and (2) that which does. The noise that does not increase with signal is considered the electronic background noise, and is shown by the ordinate intercept, , in Fig. 10. This electronic noise, Cen=150 ADU, directly degrades the available signal of the scanner. In this context, we define dynamic range as the number of available steps (S), i.e., the maximum intensity divided by electronic noise. Using the relationship between the integer quantity bit depth (b) and S, S=2b shows that the actual dynamic range of the scanner is 8 bits∕del, considerably less then the 16 bits∕del of the full scanner output. This is consistent with Canon marketing the scanner as an 8-bit scanner. This electronic noise causing the degradation is broken down further using an NPS analysis.
Calculation of gain factor
The noise that increases with signal is caused by optical quantum noise which always exists in a quantum (photon) based system (e.g., x-ray detectors, CCDs, and film cameras), and follows a linear relationship between the variance (square of the standard deviation) and the readout signal. If there was another type of noise that changed with signal, then the shape of the σ2 vs curve would not be linear. Since the shape of the curve is linear, then the noise above the electronics noise can be assumed to be only optical quantum noise.
That the system shows the presence of optical quantum noise allows a calibration of the analog to digital conversion gain in terms of the number of optically generated electrons per ADU.7 The required conversion factors are the gain, which needs to be calculated, and Cro the ordinate intercept of Fig. 8. A formula for gain can be derived from the definition of variance and the relationship of the mean to the variance resulting in Eq. 4,
| (4) |
Using offset constants Cen and Cro and a point from Fig. 10 yielded a gain factor g of 1.05±0.05 e−∕ADU. In other words each ADU corresponds to ∼1 e− and each del can collect ∼216 or 65 536 e− before saturation of the analog to digital converter. Further, it means that the scanner’s baseline gain setting of 1 is an actual gain of 1 and can be scaled accordingly through its settings. With the use of g as a conversion factor, the data were plotted in Fig. 14.
Figure 14.
Variance vs mean of the number of electrons absorbed for a given del. The area below the ordinate intercept represents the electronic noise of the system as it does not increase with mean value. The remaining region, that between the ordinate intercept and the linear fit, represents the quantum noise.
Dynamic range: Medical requirements
Current literature lists dynamic range requirements for specific modalities and for specific pixel sizes,8 but document scanners typically have far smaller pixels than current medical imaging devices. The scanner’s pixels are so small that when viewed in radiography they would be binned from their del-sized pixels into larger n*nviewing pixels that would conform better to standard radiographic pixel sizes. The process of binning pixels increases the signal linearly with the binning ratio (n2) and the noise as n (the square root of the binning ratio.) This results in an improvement in the signal to noise ratio by a factor n, increasing the effective dynamic range for each viewing pixel by n. The dynamic range required in the original del-sized pixel to allow high-quality binning and viewing can be generalized and expressed as function of viewing pixel size by examining the radiographic requirements.
In a radiographic system we can express a desired exposure range that reaches the detector and must be detected. This exposure range tells us the maximum (Xmax) and minimum (Xmin) number of x rays∕pixel to the detector. Between the number Xmax and Xmin it is not necessary to detect every quantum level since the number of quanta reaching the detector varies statistically due to quantum noise. It is instead sufficient that the system’s step size be defined as the size of the quantum noise. Therefore, we define the smallest step size of this system as being equal to the quantum noise of the minimum number of x rays received . We can then define the minimum required number of steps to be the exposure range over the step size,
| (5) |
Using the relationship between b and S, and converting exposure X to standard units of roentgens and surface area, allows the equation to be re-expressed as a relation between pixel pitch and the dynamic range requirement in bits per pixel,
| (6) |
where p is the pixel pitch, C the number of photons∕area per roentgen, and Emax−Emin is the appropriate exposure range to the detector for the specific medical procedure. This relationship can be evaluated before or after binning, as the improvement in dynamic range from binning proportionally follows the requirements. These equations apply only to linear systems, i.e., where the step size is consistent throughout the system. It is known, for example, that if the characteristic curve was , then varying step sizes could be used to reduce the number of required bits.9
Chest radiography and mammography
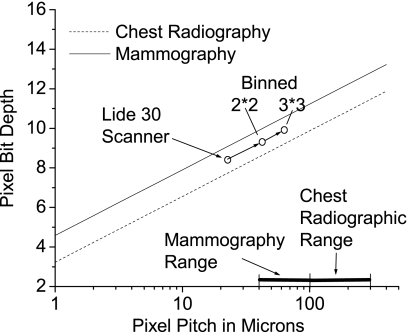
Mammography and chest radiography will be considered as examples of possible imaging tasks as they encompass the extremes of resolution and dynamic range required in diagnostic radiographic procedures. For both applications the requirements can be found in Zhao,8 and are 0.03–3 mR at 120 kVp for chest radiography and 0.6–240 mR at 30 kVp for mammography. We treat the spectrum as a monoenergetic beam, and thus the requirements correspond to ∼3×10¹⁰ x rays∕cm2 per R for chest radiography and ∼6×10⁸ x rays∕cm2 per R for mammography.10 Using Eq. 6 with these numbers shows that 7.6 bits per scanner del for chest radiography and 9 bits per scanner del for mammography are required to make a proper medical exposure. This gives an intuitive interpretation of the dynamic range requirements of medical applications for the smaller dels of our scanner.
This scanner (8 bits per del) has sufficient dynamic range for chest radiography. For mammography, the examined scanner does not have sufficient dynamic range. As a possible solution, multiple sampling may create sufficient dynamic range with the XLV∕scanner system. The dynamic range has to be raised 1 bit∕del (from 8 to 9 bits), or an SNR factor of 2 (21). Since the SNR increases by the square root of the number of samples, this would require 4 (22) independent samples to increase the dynamic range from 8 to 9 bits. However, this only works if the noise in the dels is uncorrelated. This may not be true since a presampling blur is created by the lenses in the scanner, which may result in the noise between dels being correlated. Thus, the SNR will not simply increase by the square root of the number of samples, but by some smaller margin. In this case, more independent samples would be required to obtain sufficient dynamic range for mammography.
The dynamic range requirements calculated for the scanner above can be generalized and applied to any device, with any pixel size smaller than traditional requirements. Figure 15 represents the results of varying the pixel size in Eq. 6, with two lines on the plot each representing the requirements of the mammography and chest radiography procedures. On this chart a detector with pixels having properties that lie above a line meet the necessary requirements for the corresponding procedure. As an example the abilities of the LiDE 30 scanner can be quickly ascertained from its position on the graph; the effect of binning the dels is also demonstrated. From the fact that the lines on the graph are all parallel, it follows that images obtained with such a detector will continue to have sufficient dynamic range even when the image pixels are binned for viewing.
Figure 15.
A plot of the required dynamic range in bits per pixel for a given pixel pitch: The lines indicate the requirements of two different procedures, mammography and chest radiography, and if a detector’s pixel’s have properties that lie above a procedure’s line, then that detector is suited for that procedure. The lines were obtained by plotting Eq. 5, which uses exposure requirements to dictate the relationship between a pixel’s dynamic range and its pitch. The plot indicates the position of the measured scanner for reference, and as expected it meets the requirements for chest radiography, but not mammography. Further, the result of area binning of the scanner dels is demonstrated, and shown to result in a translation parallel to the requirement lines. In the bottom right corner is an indicator of the standard pixel pitch of modern radiographic and mammographic detectors.
The above dynamic range requirements consider only a single stage detector, and do not take into account possible loss in dynamic range throughout a multiple stage detector if for example a quantum sink were to be present.11 Correct calibration ensures that the XLV∕scanner system will not suffer from this type of problem.
Signal to noise ratio calculation
Given the requirements for chest radiography and mammography, and the description of the noise added to measurements by the scan subsystem, it is possible to calculate the SNR degradation caused by the scanner. In chest radiography, each pixel of the scanner must be able to measure at maximum and minimum 397 and 3.97 photons, respectively. These values allow the calculation of SNR of the incoming signal. This signal is then degraded by both the readout light photons and by the electronic background noise. Since our gain is very close to unity, we can substitute ADUs for readout light photons. The minimum and maximum readout values are calculated per Eq. 7 and substituted into Eq. 8 which represents the summation of all three noise sources,
| (7) |
| (8) |
The results for both chest radiography and Mammography are shown in Table 2, and demonstrate the change in signal to noise ratio that results from processing through the scanner. This clearly shows that the largest part of the signal degradation arises from electronic noise and not the quantum nature of the optical readout.
Table 2.
Effective SNR degradation for pixels treated individually. The SNR degradation is examined for a single pixel. The resulting SNR does not reflect the requirements of either procedures but shows the change in SNR created by the scanner subsytem.
| Type of Exposure | SNR | Variance | Optical quantum noise variance | Electronic noise variance | Change in SNR | |||
|---|---|---|---|---|---|---|---|---|
| Initial | Final | Initial | Final | |||||
| Chest | Max | 19.9 | 19.9 | 0.0502 | 0.0503 | 0.000 19 | 0.0023 | 0% |
| Radiography | Min | 1.99 | 1.8 | 0.502 | 0.554 | 0.039 | 0.23 | 9.5% |
| Mammography | Max | 25.2 | 25.2 | 0.039 | 0.039 | 0.000 19 | 0.0023 | 0% |
| Min | 1.58 | 0.82 | 0.796 | 1.22 | 0.07 83 | 0.920 | 48% | |
Noise power spectra
NPS are used to describe the noise response of a system as a function of fτ,s. In a system with no additive noise, noise would be transferred through a stage with an NPS proportional to MTF.2 In a system component like the scanner, peaks appearing within the measured spectrum represent interference arising from scanner subsystems that have specific operating frequencies that are not in phase from one readout line to the next. The procedure of subtracting lines from one another removes in-phase components before the Fourier transform. In a scanned system, any electrical component with significant power draw whose timing is not reset at the beginning of each line can cause out-of-phase interference. This out-of-phase property occurs because the periods of the noise sources are not exact multiples of the time required to scan one line, and horizontal lines are scanned sequentially with the beginning of second line {e.g., P(1,2)} being scanned after the end of the first line {e.g., P(10200,1).}
The NPS in Fig. 11 identifies two such sources of electronic interference. The 73∕144 kHz noise is an exact division, by factors of 666∕333, of the primary electronics clock frequency, fτ=48 MHz. Therefore, the noise present is either the result of a scaled-down clock for computation purposes, or a strongly aliased copy of the clock. The other major source of interference operates at fτ=187.25 kHz, which is equal, within experimental error, to the stepper motor’s pulse width modulation frequency of fτ=187.5 kHz. The interference from both these sources is probably caused by cyclical power usage from subsystems of the scanner such as the motor and the electronic chips.
The NPS in Fig. 11 also shows a source of optical noise at fs=3.28±0.01 cycles∕mm that was in phase from one scanner line to the next and consequently spatial in nature. This signal we ascribe to the spacing of the GRIN lenses, which is 0.317±0.013 mm from the beginning of one lens to the next, or fs=3.15±0.11 cycles∕mm.
Depending on amplitude, interference can appear in images as patterned noise, hindering image interpretation. The most direct way to determine if these signals affect the clarity of an image is to examine scans of uniform objects for signs of visible patterns. Of the three sources identified here, only the motor noise and the GRIN lens pattern are directly visible in images. Since the GRIN lenses represent a fixed phase pattern, it is straightforward to remove it through image correction or calibration. This was shown by the lack of GRIN lens interference in NPS analyses that included pairwise subtraction. On the other hand, the motor noise is not in phase from one line to the next. As a result it cannot be eliminated through corrections, and could only be eliminated by improving the scanner electronics.
Resolution
The MTF of the scanner in the fast scan direction is significantly poorer than that predicted from the dels aperture (Fig. 13). This can be ascribed to optical blurring in the imaging chain. In the slow scan direction the MTF is further reduced by motion blurring (Fig. 13). Both the size of the del aperture in the slow scan direction and the speed of the scanbar contribute to this change in MTF.
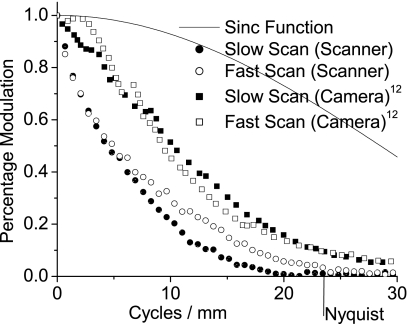
This scanner’s MTF was previously measured, under modified optical circumstances, by Wang.12 The purpose of their experiment was to use the scanner as a back end for an inexpensive large format scan camera. The GRIN lenses of the scanner were removed and a large format camera lens was used to focus light onto the plane of the scanner’s pixels. The MTF of the overall system is plotted in Fig. 16. In that figure we also plot our MTF and see that the MTF of this modified camera system is a comparatively minor improvement over the MTF of the scanner system. The difference between the two MTFs is primarily a low-frequency drop-off in the scanner that is consistent with a veiling glare arising from scatter of unwanted light.
Figure 16.
The MTF of the scanner is compared against a scan camera’s MTF based on the same scanner. The scan camera used a large format camera lens, instead of GRIN optics. The resulting difference in MTFs can be attributed to veiling glare arising from the scatter of unwanted light.
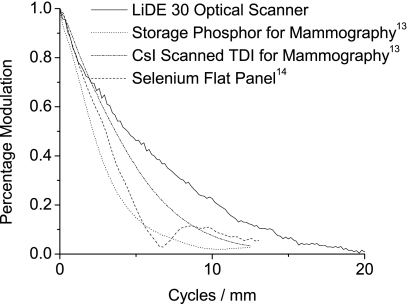
When comparing medical devices, resolution is often compared by pixel size.8 This scanner has a smaller pixel size than any medical device currently on the market. For example, mammography detectors, which have the smallest pixels, are in the range of 40 to 100 microns, more than 2–5 times the pixel pitch of the scanner. Comparing pixel sizes, however, assumes that the MTF of the device closely follows the sinc function, which the scanner does not. A better metric is to compare the MTFs directly. Figure 17 compares the minimum MTF of the scanner with the MTF of previously measured medical devices.13, 14 It is clear from the figure that the scanner’s MTF meets or exceeds the MTF of other devices currently on the market for mammography or chest radiography. Therefore, the resolution of the scanner is sufficient to create images of adequate quality for both and mammography chest radiography.
Figure 17.
The MTF of the scanner is plotted with MTFs of medical devices and shown to exceed devices currently available for both radiography and mammography.
CONCLUSION
Methods have been established and tested to evaluate the suitability of document scanners for medical applications. These methods have been applied to a commercial scanner and it was found to have key characteristics such as a linear characteristic response, and a uniform gain of 1 ADU per electron. By analyzing the amount of noise, it was discovered that the scanner outputs data with dynamic range of 8 bits per pixel. The MTF was shown to be better than most commercial medical x-ray devices with the scanner’s MTF ∼10% even at 14 lp∕mm.
The methods established should allow rapid identification of commercial scanners suitability for medical applications. In particular, it has been shown that XLV coupling to a scanner is an effective way to digitize an XLV image for mammography and chest radiography.
ACKNOWLEDGMENTS
We gratefully acknowledge financial support from the National Institutes of Health Grant No. 5-R01-EB-002-352-02, “Low cost digital x-ray detectors using liquid crystals.”
References
- Koprinarov I., Webster C. A., MacDougall R. D., and Rowlands J. A., “The x-ray light valve: A low-cost digital radiographic imaging system,” Med. Phys. 10.1118/1.2799490 34, 4609–4611 (2007). [DOI] [PubMed] [Google Scholar]
- Webster C. A., Koprinarov I., Germann S., and Rowlands J. A., “The x-ray light valve: A potentially low-cost, digital radiographic imaging system–concept and implementation considerations,” Med. Phys. 10.1118/1.2837288 35, 939–949 (2008). [DOI] [PubMed] [Google Scholar]
- Rieppo P. M. and Rowlands J. A., “X-ray imaging with amorphous selenium: Theoretical feasibility of the liquid crystal light valve for radiography,” Med. Phys. 10.1118/1.598150 24, 1279–1291 (1997). [DOI] [PubMed] [Google Scholar]
- Yeh P. and Gu C., Optics of Liquid Crystal Displays (John Wiley, New York, 1999). [Google Scholar]
- Judy P. F., “The line spread function and modulation transfer function of a computed tomographic scanner,” Med. Phys. 10.1118/1.594283 3, 233–236 (1976). [DOI] [PubMed] [Google Scholar]
- Maidment A. D. A. and Albert M., “Conditioning data for calculation of the modulation transfer function,” Med. Phys. 10.1118/1.1534111 30, 248–253 (2003). [DOI] [PubMed] [Google Scholar]
- Holdsworth D. W., Gerson R. K., and Fenster A., “A time-delay integration charge-coupled device camera for slot scanned digital radiography,” Med. Phys. 10.1118/1.596578 17, 876–886 (1990). [DOI] [PubMed] [Google Scholar]
- Zhao W. and Rowlands J. A., “X-ray imaging using amorphous selenium: Feasibility of a flat panel self scanned detector for radiology,” Med. Phys. 10.1118/1.597628 22, 1595–1604 (1995). [DOI] [PubMed] [Google Scholar]
- Dolazza E. and Poulo L., “Optimal quantitization of noisy signals,” Proc. SPIE 454, 403–417 (1984). [Google Scholar]
- Johns H. E. and Cunningham J. R., The Physics of Radiology (C. C. Thomas, Springfield, IL, 1983), p. 722. [Google Scholar]
- Cunningham I. A., “Applied Linear-Systems Theory,” in Handbook of Medical Imaging. Vol. 1, Physics and Psychophysics, (SPIE, Bellingham, WA, 2000). [Google Scholar]
- Wang S. and Heidrich W., “The design of an inexpensive very high resolution scan camera system” Comput. Graph. Forum 23, 441–450 (2004). [Google Scholar]
- Bloomquist A. K. et al. “Quality control for digital mammography in the ACRIN DMIST trial: Part 1,” Med. Phys. 10.1118/1.2150220 33, 571–807 (2006). [DOI] [PubMed] [Google Scholar]
- Hunt D. C., Tousignant O., and Rowlands J. A., “Evaluation of the imaging properties of an amorphous selenium based flat panel detector for fluoroscopy,” Med. Phys. 10.1118/1.1707755 31, 1166–1175 (2004). [DOI] [PubMed] [Google Scholar]


