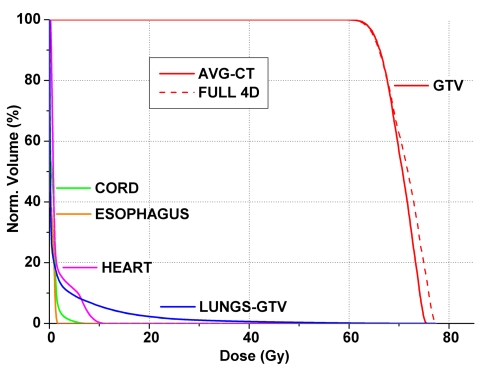
Figure 4.
Dose volume histogram for Patient 3 (superior-inferior displacement ∼2.0 cm) with solid and dashed lines indicating the cumulative dose using the AVG-CT and full 4D summation, respectively, for stereotactic body radiotherapy plans. Note the similar histogram shape for all critical structures and the tumor (GTV), yielding no noticeable differences for the critical structures between techniques. The most sensitive parameters were the maximum dose and dose to 1% of the GTV.

