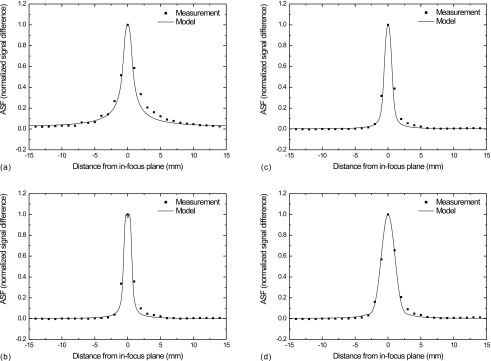
Figure 14.
Comparison between modeled and measured ASF: (a)–(d) correspond to filter schemes 1–4, respectively. The modeled ASF was calculated by multiplying the signal spectrum of a 0.4 mm diameter sphere with the presampling MTF of the DBT system, followed by an inverse Fourier transform. The vertical line with x=0 was normalized and plotted as the modeled ASF.

