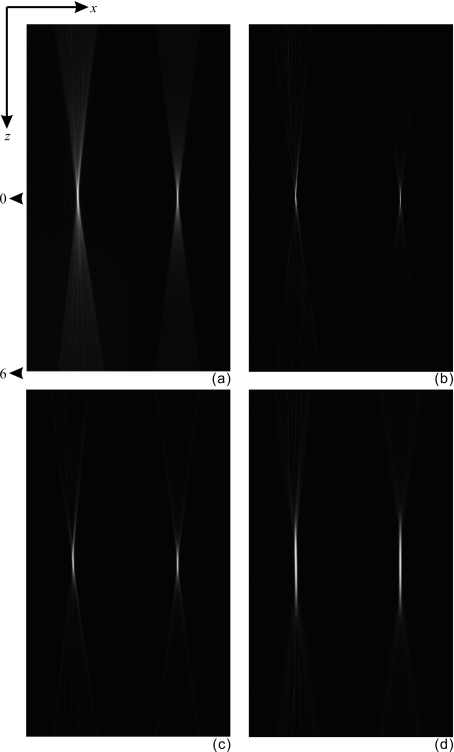
Figure 7.
Comparison between measured (left) and modeled (right) 2D PSF in the x-z plane. The graphs (a)–(d) correspond to filter schemes 1–4 listed in Table 1. The PSF in each graph is plotted from −4.85 to 4.85 mm along the x-direction, and −6 to 6 mm in the z-direction.

